Intro to Graph Theory
advertisement
Stephen P. Borgatti
Graph Theory
This is FIRST draft. Very likely to contain errors.
A
lthough graph theory is one of the younger branches of mathematics, it is
fundamental to a number of applied fields, including operations research,
computer science, and social network analysis. In this chapter we discuss the
basic concepts of graph theory from the point of view of social network analysis.
Graphs
The fundamental concept of graph theory is the graph, which (despite the name) is best
thought of as a mathematical object rather than a diagram, even though graphs have a
very natural graphical representation. A graph – usually denoted G(V,E) or G = (V,E) –
consists of set of vertices V together with a set of edges E. Vertices are also known as
nodes, points and (in social networks) as actors, agents or players. Edges are also known
as lines and (in social networks) as ties or links. An edge e = (u,v) is defined by the
unordered pair of vertices that serve as its end points. Two vertices u and v are adjacent if
there exists an edge (u,v) that connects them. An edge e = (u,u) that links a vertex to itself
is known as a self-loop or reflexive tie. The number of vertices in a graph is usually
denoted n while the number of edges is usually denoted m.
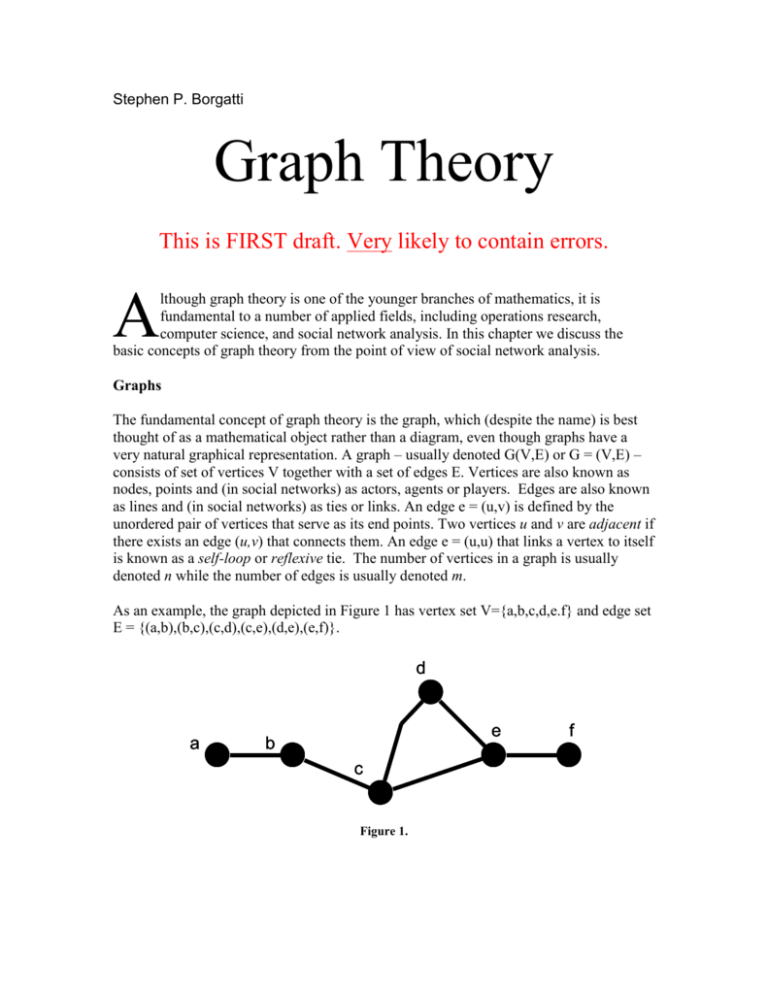
As an example, the graph depicted in Figure 1 has vertex set V={a,b,c,d,e.f} and edge set
E = {(a,b),(b,c),(c,d),(c,e),(d,e),(e,f)}.
d
a
e
b
c
Figure 1.
f
1st Draft, written very quickly. May contain errors. Be aware.
When looking at visualizations of graphs such as Figure 1, it is important to realize that
the only information contained in the diagram is adjacency; the position of nodes in the
plane (and therefore the length of lines) is arbitrary unless otherwise specified. Hence it is
usually dangerous to draw conclusions based on the spatial position of the nodes. For
example, it is tempting to conclude that nodes in the middle of a diagram are more
important than nodes on the peripheries, but this will often – if not usually – be a mistake.
When used to represent social networks, we typically use each line to represent instances
of the same social relation, so that if (a,b) indicates a friendship between the person
located at node a and the person located at node b, then (d,e) indicates a friendship
between d and e. Thus, each distinct social relation that is empirically measured on the
same group of people is represented by separate graphs, which are likely to have different
structures (after all, who talks to whom is not the same as who dislikes whom).
Every graph has associated with it an adjacency matrix, which is a binary nn matrix A
in which aij = 1 and aji = 1 if vertex vi is adjacent to vertex vj, and aij = 0 and aji = 0
otherwise. The natural graphical representation of an adjacency matrix is a table, such as
shown in Figure 2.
a
b
c
d
e
f
a
0
1
0
0
0
0
b
1
0
1
0
0
0
c
0
1
0
1
1
0
d
0
0
1
0
1
0
e
0
0
1
1
0
1
f
0
0
0
0
1
0
Figure 2. Adjacency matrix for graph in Figure 1.
Examining either Figure 1 or Figure 2, we can see that not every vertex is adjacent to
every other. A graph in which all vertices are adjacent to all others is said to be complete.
The extent to which a graph is complete is indicated by its density, which is defined as
the number of edges divided by the number possible. If self-loops are excluded, then the
number possible is n(n-1)/2. If self-loops are allowed, then the number possible is
n(n+1)/2. Hence the density of the graph in Figure 1 is 6/15 = 0.40.
A clique is a maximal complete subgraph. A subgraph of a graph G is a graph whose
points and lines are contained in G. A complete subgraph of G is a section of G that is
complete (i.e., has density = 1). A maximal complete subgraph is a subgraph of G that is
complete and is maximal in the sense that no other node of G could be added to the
subgraph without losing the completeness property. In Figure 1, the nodes {c,d,e}
together with the lines connecting them form a clique. Cliques have been seen as a way to
represent what social scientists have called primary groups.
While not every vertex in the graph in Figure 1 is adjacent, one can construct a sequence
of adjacent vertices from any vertex to any other. Graphs with this property are called
1st Draft, written very quickly. May contain errors. Be aware.
connected. Similarly, any pair of vertices in which one vertex can reach the other via a
sequence of adjacent vertices is called reachable. If we determine reachability for every
pair of vertices, we can construct a reachability matrix R such as depicted in Figure 3.
The matrix R can be thought of as the result of applying transitive closure to the
adjacency matrix A.
d
a
e
b
f
c
g
Figure 3.
A component of a graph is defined as a maximal subgraph in which a path exists from
every node to every other (i.e., they are mutually reachable). The size of a component is
defined as the number of nodes it contains. A connected graph has only one component.
A sequence of adjacent vertices v0,v1,…,vn is known as a walk. In Figure 3, the sequence
a,b,c,b,a,c is a walk. A walk can also be seen as a sequence of incident edges, where two
edges are said to be incident if they share exactly one vertex. A walk in which no vertex
occurs more than once is known as a path. In Figure 3, the sequence a,b,c,d,e,f is a path.
A walk in which no edge occurs more than once is known as a trail. In Figure 3, the
sequence a,b,c,e,d,c,g is a trail but not a path. Every path is a trail, and every trail is a
walk. A walk is closed if vo = vn. A cycle can be defined as a closed path in which n >= 3.
The sequence c,e,d in Figure 3 is a cycle. A tree is a connected graph that contains no
cycles. In a tree, every pair of points is connected by a unique path. That is, there is only
one way to get from A to B.
The length of a walk (and therefore a path or trail) is defined as the number of edges it
contains. For example, in Figure 3, the path a,b,c,d,e has length 4. A walk between two
vertices whose length is as short as any other walk connecting the same pair of vertices is
called a geodesic. Of course, all geodesics are paths. Geodesics are not necessarily
unique. From vertex a to vertex f in Figure 1, there are two geodesics: a,b,c,d,e,f and
a,b,c,g,e,f.
The graph-theoretic distance (usually shortened to just “distance”) between two vertices
is defined as the length of a geodesic that connects them. If we compute the distance
between every pair of vertices, we can construct a distance matrix D such as depicted in
Figure 4. The maximum distance in a graph defines the graph’s diameter. As shown in
1st Draft, written very quickly. May contain errors. Be aware.
Figure 4, the diameter of the graph in Figure 1 is 4. If the graph is not connected, then
there exist pairs of vertices that are not mutually reachable so that the distance between
them is not defined and the diameter of such a graph is also not defined.
a
b
c
d
e
f
g
a b c d e f g
0 1 2 3 3 4 3
1 0 1 2 2 3 2
2 1 0 1 1 2 1
3 2 1 0 1 2 2
3 2 1 1 0 1 1
4 3 2 2 1 0 2
3 2 1 2 1 2 0
Figure 4. Distance matrix for graph in Figure 3.
The powers of a graph’s adjacency matrix, Ap, give the number of walks of length p
between all pairs of nodes. For example, A2, obtained by multiplying the matrix by itself,
has entries aij2 that give the number of walks of length 2 that join node vi to node vj.
Hence, the geodesic distance matrix D has entries dij = p, where p is the smallest p such
that aijp > 0. (However, there exist much faster algorithms for computing the distance
matrix.)
The eccentricity e(v) of a point v in a connected graph G(V,E) is max d(u,v), for all u
V. In other words, a point’s eccentricity is equal to the distance from itself to the point
farthest away. The eccentricity of node b in Figure 3 is 3. The minimum eccentricity of
all points in a graph is called the radius r(G) of the graph, while the maximum
eccentricity is the diameter of the graph. In Figure 3, the radius is 2 and the diameter is 4.
A vertex that is least distant from all other vertices (in the sense that its eccentricity
equals the radius of the graph) is a member of the center of the graph and is called a
central point. Every tree has a center consisting of either one point or two adjacent
points.
The number of vertices adjacent to a given vertex is called the degree of the vertex and is
denoted d(v). It can be obtained from the adjacency matrix of a graph by simply
computing each row sum. For example, the degree of vertex c in Figure 3 is 4. The
average degree, d , of all vertices depicted in Figure 3 is 2.29. There is a direct
relationship between the average degree, d , of all vertices in a graph and the graph’s
density:
density
d
n 1
The minimum degree of a graph G is denoted (G). A vertex with degree 0 is known as
an isolate (and constitutes a component of size 1), while a vertex with degree 1 is a
1st Draft, written very quickly. May contain errors. Be aware.
pendant. Holding average degree constant, there is a tendency for graphs that contain
some nodes of high degree (i.e., high variance in degree) to have shorter distances than
graphs with lower variance, with the high degree nodes serving as “shortcuts” across the
network.
A node whose removal from a graph disconnects the graph (or, more generally, increases
the number of components in the graph) is called a cutpoint or an articulation point. The
graph in Figure 3 has three cutpoints, namely b, c, and e. A connected, non-trivial graph
is called non-separable if it has no cutpoints. A block or bi-component is a maximal
nonseparable subgraph. Blocks partition the edges in a graph into mutually exclusive
edges. They also share no nodes except cutpoints. Thus, cutpoints decompose graphs into
(nearly) non-overlapping sections. In blocks of more than two points, every pair of points
lies along a common cycle, which means that there is always a minimum of two ways to
get from any point to any other. In Figure 3, we find the following blocks: {a,b}, {b,c},
{c,d,e,g}, {e,f}.
The notion of a cutpoint can be generalized to a cutset, which is a set of points whose
joint removal increases the number of components in the graph. Of particular interest is a
minimum weight cutset, which is a cutset that is as small as possible (i.e., no other cutset
has fewer members). There can be more than one distinct minimum weight cutset in a
graph. The size of a graph’s minimum weight cutset defines the vertex connectivity κ(G)
of a graph, which is the minimum number of nodes that must be removed to increase the
number of components in the graph (or render it trivial). The point connectivity of a
disconnected graph is 0. The point connectivity of a graph containing a cutpoint is no
higher than 1. The point connectivity of a non-separable graph is at least 2. We can
analogously define the vertex connectivity κ(u,v) of a pair of points u,v as the number of
nodes that must be removed to disconnect that pair. The connectivity of the graph κ (g) is
just the minimum κ (u,v) for all u,v in V.
A famous theorem by Menger published in 1929 relates the vertex connectivity of a pair
of nodes to the maximum number of node-independent paths connecting those nodes. A
set of paths from a source node s to a target node t is node-independent if none of the
paths share any vertices aside from s and t. Menger’s theorem states that for any source s
and target t, the maximum number of node-independent paths between s and t is equal to
the vertex connectivity of that pair – i.e., the number of nodes that must be removed to
disconnect them. Hence, there might be many different paths from s to t, but if they all
share a certain node (i.e., are not independent), then s and t can easily be disconnected by
eliminating just that node.
Thus, we can think of the point connectivity of a graph as an indicator of the
invulnerability of the graph to threats of disconnection by removal of nodes. If κ(G) is
high, or if the average κ (u,v) is high for all pairs of nodes, then we know that it is fairly
difficult to disconnect the nodes in the graph by removing intermediaries.
The vertex-based notions of cutpoint, cutset, vertex connectivity and node-independent
path set have analogous counterparts for edges. A bridge is defined as an edge whose
1st Draft, written very quickly. May contain errors. Be aware.
removal would increase the number of components in the graph. Edge connectivity is
denoted (G) and the edge connectivity of a pair of nodes is denoted (u,v). A
disconnected graph has (G)=0, while a graph with a bridge has (G)=1. Point
connectivity and line connectivity are related to each other and to the minimum degree in
a graph by Whitney’s inequality:
(G ) (G ) (G )
Directed Graphs
As noted at the outset, the edges contained in graphs are unordered pairs of nodes (i.e.,
(u,v) is the same thing as (v,u)). As such, graphs are useful for encoding directionless
relationships such as the social relation “sibling of” or the physical relation “is near”.
However, many relations that we would like to model are not directionless. For example,
“is the boss of” is usually anti-symmetric in the sense that if u is the boss of v, it is
unlikely that v is the boss of u. Other relations, such as “gives advice to” are simply nonsymmetric in the sense that if u gives advice to v, v may or may not give advice to u.
To model non-symmetric relations we use directed graphs, also known as digraphs. A
digraph D(V,E) consists of a set of nodes V and a set of ordered pairs of nodes E called
arcs or directed lines. The arc (u,v) points from u to v.
Digraphs are usually represented visually like graphs, except that arrowheads are placed
on lines to indicate direction (see Figure 5). When both arcs (u,v) and (v,u) are present in
a digraph, they may be represented by a double-headed arrow (as in Figure 5a), or two
separate arrows (as shown in Figure 5b).
d
a
b
c
Figure 5a
e
f
1st Draft, written very quickly. May contain errors. Be aware.
d
a
b
c
e
f
Figure 5b
In a digraph, a walk is a sequence of nodes vo,v1,…vn in which each pair of nodes vi, vi+1
is linked by an arc (vi,vi+1). In other words, it is a traversal of the graph in which the flow
of movement follows the direction of the arcs, like a car moving from place to place via
one-way streets. A path in a digraph is a walk in which all points are distinct. A semiwalk
is a sequence of nodes vo,v1,…vn in which each pair of nodes vi, vi+1 is linked by either
the arc (vi,vi+1) or the arc (vi+1,vi). In other words, in a semiwalk, the traversal need not
respect the direction of arcs, like a car that freely goes the wrong way on one-way streets.
By analogy, we can also define a semipath, semitrail, and semicycle.
Another way to think of semiwalks is as walks on the underlying graph, where the
underlying graph is the graph G(V,E) that is formed from the digraph D(V,E’) such that
(u,v) E if and only if (u,v) E’ or (v,u) E’. Thus, the underlying graph of a digraph
is basically the graph formed by ignoring directionality.
A digraph is strongly connected if there exists a path (not a semipath) from every point to
every other. Note that the path from u to v need not involve the same intermediaries as
the path from v to u. A digraph is unilaterally connected if for every pair of points there is
a path from one to the other (but not necessarily the other way around). A digraph is
weakly connected if every pair of points is mutually reachable via a semipath (i.e., if the
underlying graph is connected).
A strong component of a digraph is a maximal strongly connected subgraph. In other
words, it is a subgraph that is strongly connected and which is as large as possible (there
is no node outside the subgraph that is strongly connected to all the nodes in the
subgraph). A weak component is a maximal weakly connected subgraph.
The number of arcs originating from a node v (i.e., outgoing arcs) is called the outdegree
of v, denoted od(v). The number of arcs pointing to a node v (i.e., incoming arcs) is called
the indegree of v, denoted id(v). In a graph representing friendship feelings among a set
of persons, outdegree can be seen as indicating gregariousness, while indegree
corresponds to popularity. The average outdegree of a digraph is necessarily equal to the
average indegree.
The adjacency matrix A of a digraph is an n × n matrix in which aij = 1 if (vi,vj) E and
aij = 0 otherwise. Unlike the adjacency matrix of an undirected graph, the adjacency
1st Draft, written very quickly. May contain errors. Be aware.
matrix of a directed graph is not constrained to be symmetric, so that the top right half
need not equal the bottom left half (i.e., aij <> aji). If a digraph is acyclic, then it is
possible to order the points of D so that the adjacency matrix upper triangular (i.e., all
positive entries are above the main diagonal).
Social Network Extensions to Graph Theory
In this section we consider contributions to graph theory from the study of social
networks. There are two main groups of contributions: cohesive subsets and
roles/positions. Note that the definitions of cohesive subsets assume graphs, while those
of roles/position assume digraphs.
Cohesive Subsets
It was mentioned earlier that the notion of a clique can be seen as formalizing the notion
of a primary group. A problem with this, however, is that it is too strict to be practical:
real groups will contain several pairs of people who don’t have a close relationship. A
relaxation and generalization of the clique concept is the n-clique. An n-clique S of a
graph is a maximal set of nodes1 in which for all u,v S, the graph-theoretic distance
d(u,v) <= n. In other words, an n-clique is a set of nodes in which every node can reach
every other in n or fewer steps, and the set is maximal in the sense that no other node in
the graph is distance n or less from every other node in the subgraph. A 1-clique is the
same as an ordinary clique. The set {a,b,c,d,e} in Figure 6 is an example of a 2-clique.
b
c
d
a
f
e
Figure 6.
Note that the path of length n or less linking a member of the n-clique to another member
may pass through an intermediary who is not in the group. In the 2-clique in Figure 6,
nodes c and e are distance 2 only because of d, which is not a member of the 2-clique. In
this sense, n-cliques are not as cohesive as they might otherwise appear. The notion of an
n-clan avoids that. An n-clan is an n-clique in which the diameter of the subgraph G’
1
Cohesive subsets are traditionally defined in terms of subgraphs rather than subsets of nodes. However,
since most people think about them in terms of node sets, and because using subgraphs complicates
notation, we used subsets here.
1st Draft, written very quickly. May contain errors. Be aware.
induced by S is less than or equal to n. The subgraph G’ of a graph G induced by the set
of nodes S is defined as the maximal subgraph of G that has point set S. In other words, it
is the subgraph of G obtained by taking all nodes in S and all ties among them. Therefore,
an n-clan S is an n-clique in which all pairs have distance less than or equal to n even
when we restrict all paths to involve only members of S. In Figure 6, the set {b,c,d,e,f} is
a 2-clan, but {a,b,c,d,e} is not because b and c have distance greater than 2 in the induced
subgraph. Note that {a,b,f,e} is also fails the 2-clan criterion because n-clans are defined
to be n-cliques and {a,b,f,e} is not a 2-clique (it fails the maximality criterion since
{a,b,c,d,e}). An n-club corrects this problem by eliminating the n-clique criterion from
the definition. An n-club is a subset S of nodes such that in the subgraph induced by S,
the diameter is n or less. Every n-clan is both an n-club and an n-clique. The set {a,b,c,f}
is a 2-club.
Whereas n-cliques, n-clans and n-clubs all generalize the notion of clique via relaxing
distance, the k-plex generalizes the clique by relaxing density. A k-plex is a subset S of
nodes such that every member of the set is connected to n-k others, where n is the size of
S. Although not part of the official definition, it is conventional to additionally impose a
maximality condition, so that proper subsets of k-plexes are ignored. There are some
guarantees on the cohesiveness of k-plexes. For example, k-plexes in which k < (n+2)/2
have no distances greater than 2 and cannot contain bridges (making them resistant to
attack by deleting an edge). In Figure 6, the set {a,b,c,f} fails to be a 2-plex because each
member must have at least 4-2=2 ties to other members of the set, yet c has only one tie
within the group. In the graph in Figure 7, the set {a,b,d,e} is a 2-plex.
a
b
c
e
d
Figure 7.
More cohesive than k-plexes are LS sets. Let H be a set of nodes in graph G(V,E) and let
K be a proper subset of H. Let α(K) denote the number of edges linking members of K to
V-K (the set of nodes not in K). Then H is an LS set of G if for every proper subset K of
H, α(K) > α(H). The basic idea is that individuals in H have more ties with other
members than they do to outsiders. Another way to define LS sets that makes this more
evident is as follows. Let α(X,Y) denote the number of edges from members of set X to
members of set Y. Then H is an LS set if α(K,H-K) > α(K,V-H). In Figure 7, the set
{a,b,d,e} is not an LS set since α({b,d,e},{a}) is not greater than α({b,d,e},{c}). In
contrast, the set {a,b,d,e} in Figure 8 does qualify as an LS set.
1st Draft, written very quickly. May contain errors. Be aware.
a
b
c
e
d
Figure 8.
A key property of LS sets is high edge connectivity. Specifically, every node in an LS set
has higher edge connectivity () with other members of the LS set than with any nonmember. Taking this as the sole criterion for defining a cohesive subset, a lambda set is
defined as a maximal subset of nodes S such that for all a,b,c S and d V-S, (a,b) >
(c,d). To the extent that is high, members of the same lambda set are difficult to
disconnect from one another because defines the number edges that must be removed
from the graph in order to disconnect the nodes within the lambda set.
A k-core is a maximal subgraph H in which δ(H) >= k. Hence, every member of a 2-core
is connected to at least 2 other members, and no node outside the 2-core is connected to 2
or more members of the core (otherwise it would not be maximal). Every k-core contains
at least k+1 vertices, and vertices in different k-cores cannot be adjacent. A 1-core is
simply a component. K-cores can be described as loosely cohesive regions which will
contain more cohesive subsets. For example, every k-plex is contained in a k-core.
Roles/Positions
Given a digraph D(V,E), the in-neighborhood of a node v, denoted Ni(v) is the set of
vertices that send arcs to v. That is, Ni(v) = {u: (u,v) E}. The out-neighborhood of a
node v, denoted No(v) is the set of vertices that receive arcs from v. That is, No(v) = {u:
(v,u) E}.
A coloration C is an assignments of colors to the vertices V of a digraph. The color of a
vertex v is denoted C(v) and the set of distinct colors assigned to nodes in a set S is
denoted C(S) and termed the spectrum of S. In Figure 9, a coloration of nodes is depicted
by labeling the nodes with letters such as ‘r’ for red, and ‘y’ for yellow. Nodes colored
the same are said to be equivalent.
1st Draft, written very quickly. May contain errors. Be aware.
a
b
r
y
e
w
c
r
y
d
Figure 9.
A coloration is a strong structural coloration if nodes are assigned the same color if and
only if they have identical in and out neighborhoods. That is, for all u,v V, C(u) = C(v)
if and only if Ni(u) = Ni(v) and No(u) = No(v). The coloration in Figure 9 is a strong
structural coloration. We can check this by taking pairs of nodes and verifying that if
they are colored the same (i.e., are strongly structurally equivalent) they have identical
neighborhoods, and if they are not colored the same, they have different neighborhoods.
For example, b and d are colored the same, and both of their neighborhoods consist of
{a,c,e}.
Note that in strong structural colorations, any two nodes that are colored the same are
structurally identical: if we remove the identifying labels from the identically colored
nodes, then spin the graph around in space before placing it back down on the page, we
would not be able to figure out which of the same-colored nodes was which.
Consequently, any property of the nodes that stems from their structural position (such as
expected time until arrival of something flowing through the network) should be the same
for nodes that are equivalent.
A coloration C is regular if C(u) = C(v) implies that C(Ni(u)) = C(Ni(v)) and C(No(u)) =
C(No(v)) for all u, v V. In other words, in regular colorations, every pair of nodes that
has the same color must receive arcs from nodes comprising the same set of colors and
must send arcs to nodes comprising the same set of colors. Every structural coloration is a
regular coloration.
a
b
r
y
e
r
c
r
y
d
Figure 10. Regular coloration.
1st Draft, written very quickly. May contain errors. Be aware.
The coloration in Figure 10 (which depicts the same digraph as in Figure 9) is regular,
but not strongly structural. To see this, consider that every red node has an outneighborhood containing only yellow nodes (e.g., C(No(a)={y}) , and an in-neighborhood
containing only yellow nodes, while every yellow node has an out-neighborhood
containing only red nodes and an in-neighborhood containing only red nodes. Figure 11
depicts another regular coloration. Note that node g could not be colored the same as f or
i, because it has an outneighborhood consisting of a white node, while f and i have no
outneighborhood at all. Consequently node p could not be colored the same as c and e,
since p’s out-neighborhood contains a node of a different color than the c and e. This also
implies that g cannot be colored the same as f and i because it received a tie from a node
of a different color.
a
b
b
b
c
r
f
p
g
y
e
d
r
h
s
g
i
y
j
w
Figure 11. Regular coloration
If a graph represents a social network, we can think of the colors as defining emergent
classes or types of people such that if one member of a certain class (blue) has outgoing
ties to members of exactly two other classes (yellow and green), then all other members
of that (blue) class have outgoing ties to members of those same two classes (yellow and
green). Thus, regular colorations classify members of a social network according to their
pattern of relations of others, and two people are placed in the same class if they interact
in the same ways with the same kinds of others (but not necessarily with same
individuals).
Just as the various generalizations of cliques are attempts to capture mathematically the
notion of a social group, regular colorations are an attempt to capture the notion of a
social role system, in which people playing a certain role have characteristic relations
with others who are playing complementary roles (such as doctors, nurses and patients).
