Polynomial Functions and Their Graphs:
advertisement
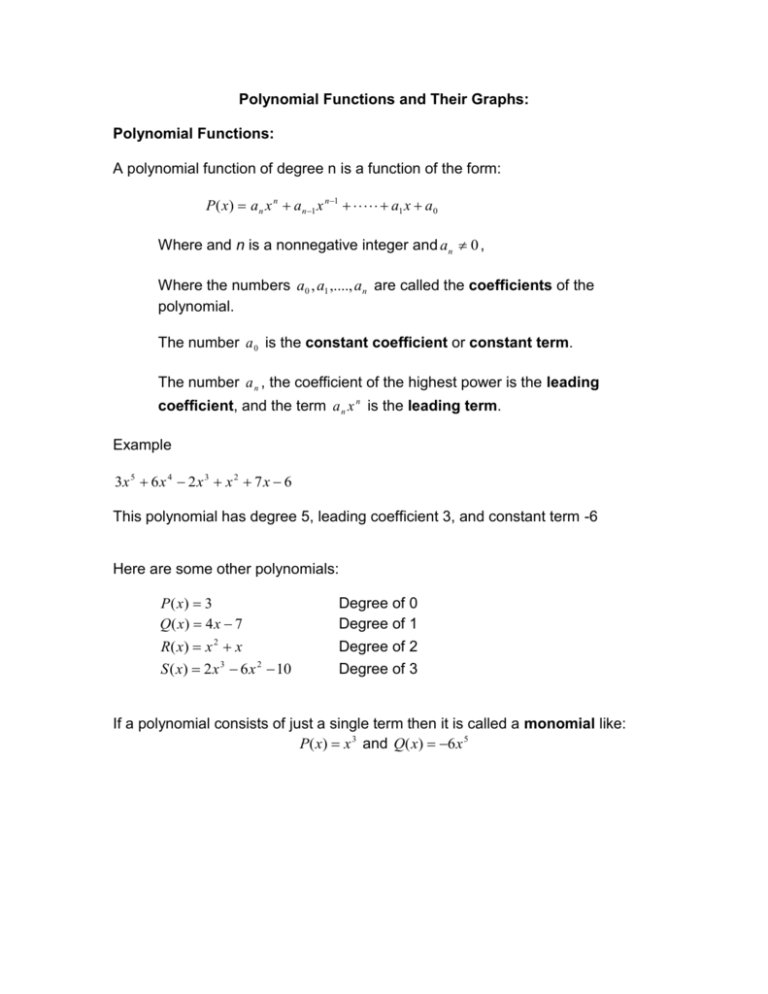
Polynomial Functions and Their Graphs: Polynomial Functions: A polynomial function of degree n is a function of the form: P (x) a n x n a n 1 x n 1 a1 x a0 Where and n is a nonnegative integer and an 0 , Where the numbers a0 , a1 ,...., a n are called the coefficients of the polynomial. The number a 0 is the constant coefficient or constant term. The number a n , the coefficient of the highest power is the leading coefficient, and the term a n x n is the leading term. Example 3x 5 6 x 4 2 x 3 x 2 7 x 6 This polynomial has degree 5, leading coefficient 3, and constant term -6 Here are some other polynomials: P( x) 3 Q( x) 4 x 7 Degree of 0 Degree of 1 R( x) x 2 x Degree of 2 Degree of 3 S ( x) 2 x 3 6 x 2 10 If a polynomial consists of just a single term then it is called a monomial like: P( x) x 3 and Q( x) 6 x 5 Graphs of Polynomials: *The graphs of polynomials of degree 0 or 1 are lines. *The graphs of polynomials of degree 2 are parabolas. *The greater the degree of the polynomial, the more complicated its graph can be. *The graph of a polynomial function is always a smooth curve; that is it has no breaks or corners. Examples of graphs of non polynomial functions: There is a break and a hole Examples of graphs of polynomial functions: There is a corner and a sharp turn End Behavior and the Leading Term: The end behavior of a polynomial is a description of what happens as x becomes large in the positive or negative direction. To describe the end behavior we use the following: x means “x becomes large in the positive direction” x means “x becomes large in the negative direction” For any polynomial, the end behavior is determined by the term that contains the highest power of x, because when x is large, the other terms are relatively insignificant in size. The following chart shows the four possible types of end behavior based on the highest power and the sign of its coefficient. End Behavior of Polynomials: The end behavior of the polynomial P (x) a n x n a n 1 x n 1 a1 x a0 is determined by the degree n and the sign of the leading coefficient a n as indicated in the following graphs: P has odd degree (Leading coefficient positive) (Leading coefficient negative) as x y as x y as x y as x y P has even degree (Leading coefficient positive) as x y (Leading coefficient negative) as x y as x y as x y Determine the end behavior of the following polynomials: 1) p( x) 2 x 4 5 x 3 4 x 7 2) P( x ) 3 x 5 5 x 3 2 x 3) f ( x) 3x 3 20 x 2 60 x 2 4) y 8 x 3 7 x 2 3x 7 Using Zeros to Graph a Polynomial: The values of x that make the polynomial equal to zero. If P( x) ( x 2)( x 3) then the zeros of the polynomials are 2 and -3. This means that the graph of this polynomial crosses the x-axis at 2 and -3 (2 and -3 are the x intercepts) If P is a polynomial and c is a real number, then the following are equivalent: 1) c is a zero of P. 2) x c is a solution of the equation P( x) 0 . 3) x c is a factor of P (x ) . 4) x c is an x-intercept of the graph of P. Guidelines for Sketching Graphs Polynomial Functions: 1) 2) 3) 4) Zeros: Factor the polynomial to find all its real zeros; these are the xintercepts of the graphs. Test points: Make a table of values for the polynomial. Include test points to determine whether the graph of the polynomial lies above or below the x-axis on the intervals determined by the zeros. Include the yintercept in the table (X=0). End Behavior: Determine the end behavior of the polynomial from the table. Graph: Plot the intercepts and the other points you found in the table. Sketch a smooth curve that passes through these points and exhibits the required end behavior. 5) Use the zeros to graph the following: P( x) ( x 2)( x 1)( x 3)

