Handout for Getting Descriptive Statistics in Excel
advertisement
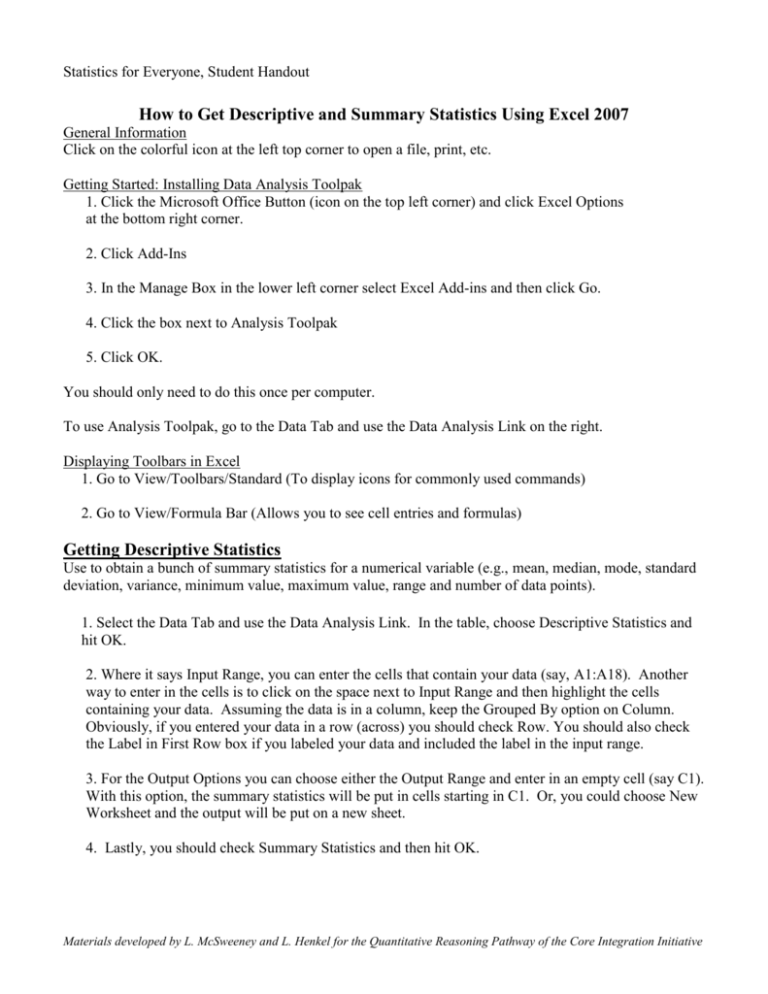
Statistics for Everyone, Student Handout How to Get Descriptive and Summary Statistics Using Excel 2007 General Information Click on the colorful icon at the left top corner to open a file, print, etc. Getting Started: Installing Data Analysis Toolpak 1. Click the Microsoft Office Button (icon on the top left corner) and click Excel Options at the bottom right corner. 2. Click Add-Ins 3. In the Manage Box in the lower left corner select Excel Add-ins and then click Go. 4. Click the box next to Analysis Toolpak 5. Click OK. You should only need to do this once per computer. To use Analysis Toolpak, go to the Data Tab and use the Data Analysis Link on the right. Displaying Toolbars in Excel 1. Go to View/Toolbars/Standard (To display icons for commonly used commands) 2. Go to View/Formula Bar (Allows you to see cell entries and formulas) Getting Descriptive Statistics Use to obtain a bunch of summary statistics for a numerical variable (e.g., mean, median, mode, standard deviation, variance, minimum value, maximum value, range and number of data points). 1. Select the Data Tab and use the Data Analysis Link. In the table, choose Descriptive Statistics and hit OK. 2. Where it says Input Range, you can enter the cells that contain your data (say, A1:A18). Another way to enter in the cells is to click on the space next to Input Range and then highlight the cells containing your data. Assuming the data is in a column, keep the Grouped By option on Column. Obviously, if you entered your data in a row (across) you should check Row. You should also check the Label in First Row box if you labeled your data and included the label in the input range. 3. For the Output Options you can choose either the Output Range and enter in an empty cell (say C1). With this option, the summary statistics will be put in cells starting in C1. Or, you could choose New Worksheet and the output will be put on a new sheet. 4. Lastly, you should check Summary Statistics and then hit OK. Materials developed by L. McSweeney and L. Henkel for the Quantitative Reasoning Pathway of the Core Integration Initiative Individual Functions (Use to calculate individual summary statistics of a numerical variable) Click in a blank cell and type the appropriate command. For most commands you will need to enter or highlight a range of cells for the data you want to summarize. In the examples below cell ranges C1:C26 and D1:D26 will be used to represent the cell ranges of interest. Function Mean or Average of the data in cells C1:C26 Median of the data in cells C1:C26 Standard Deviation of the data in cells C1:C26 Variance of the data in cells C1:C26 Minimum of the data in cells C1:C26 Maximum of the data in cells C1:C26 Number of observations in cells C1:C26 Correlation between the data in cells C1:C26 and D1:D26 Command =average(C1:C26) =median(C1:C26) =stdev(C1:C26) =var(C1:C26) =min(C1:C26) =max(C1:C26) =count(C1:C26) =correl(C1:C26, D1:D26) There are many other mathematical and statistical functions. You can access them by clicking on the insert function icon ( fx ) in the main toolbar. 2


