Spengler
advertisement
The new Quality Control- and Monitoring System of the Deutscher Wetterdienst
Reinhard Spengler
Deutscher Wetterdienst, Frankfurter Straße 135, D-63067 Offenbach,Germany
Tel.: +49(0)69-8062-2156, Fax: +49(0)69-8062-3809, E-mail: Reinhard.Spengler@dwd.de
1
Introduction
The Deutscher Wetterdienst (DWD) is currently modernising its meteorological observation network ('Messnetz 2000').
In the course of this modernisation, extensive measures will be introduced in order to improve and assure the quality of
the data obtained. This will be achieved firstly by continuous monitoring of the functional status of the stations and
sensors, and secondly by a series of quality controls of the data. The key element of this intensive quality control is the
interactive data control and monitoring system QualiMET.
2
Levels of quality assurance in the 'Messnetz 2000' (Measurement Network 2000)
There is already fully automated data checking at the
weather station (level 1). In addition, the devices and
sensors are continually monitored to ensure that they
are in good working order.
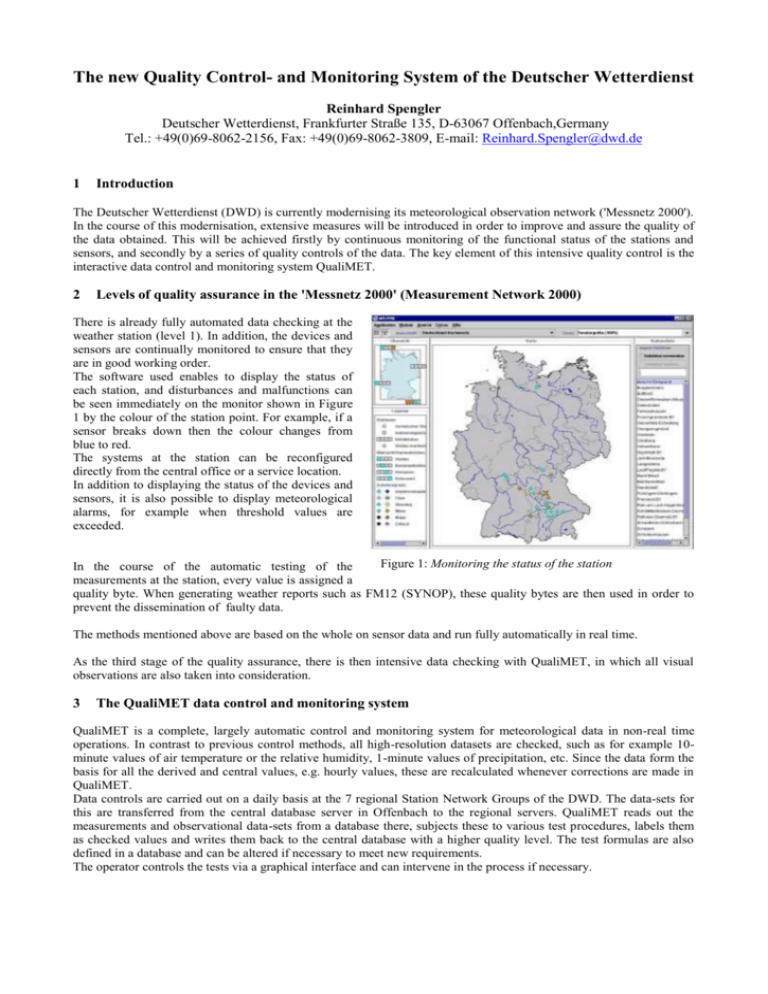
The software used enables to display the status of
each station, and disturbances and malfunctions can
be seen immediately on the monitor shown in Figure
1 by the colour of the station point. For example, if a
sensor breaks down then the colour changes from
blue to red.
The systems at the station can be reconfigured
directly from the central office or a service location.
In addition to displaying the status of the devices and
sensors, it is also possible to display meteorological
alarms, for example when threshold values are
exceeded.
Figure 1: Monitoring the status of the station
In the course of the automatic testing of the
measurements at the station, every value is assigned a
quality byte. When generating weather reports such as FM12 (SYNOP), these quality bytes are then used in order to
prevent the dissemination of faulty data.
The methods mentioned above are based on the whole on sensor data and run fully automatically in real time.
As the third stage of the quality assurance, there is then intensive data checking with QualiMET, in which all visual
observations are also taken into consideration.
3
The QualiMET data control and monitoring system
QualiMET is a complete, largely automatic control and monitoring system for meteorological data in non-real time
operations. In contrast to previous control methods, all high-resolution datasets are checked, such as for example 10minute values of air temperature or the relative humidity, 1-minute values of precipitation, etc. Since the data form the
basis for all the derived and central values, e.g. hourly values, these are recalculated whenever corrections are made in
QualiMET.
Data controls are carried out on a daily basis at the 7 regional Station Network Groups of the DWD. The data-sets for
this are transferred from the central database server in Offenbach to the regional servers. QualiMET reads out the
measurements and observational data-sets from a database there, subjects these to various test procedures, labels them
as checked values and writes them back to the central database with a higher quality level. The test formulas are also
defined in a database and can be altered if necessary to meet new requirements.
The operator controls the tests via a graphical interface and can intervene in the process if necessary.
3.1 System architecture
QualiMET has a 3-layer architecture (see Figure
2).
Layer 1 is the central server in the head
office,
with
the
ORACLE-databases
containing the measurements, meta-data and
test instructions. These data-sets are
administered by QualiMET-Admin, which is
designed as a single-user application.
Layer 2 are the regional servers, located at
one of the 7 sites of the regional Station
Network Groups of the DWD. The regional
servers receive the data-sets requested from
the central server and store it for a period of
14 days in their local ORACLE-databases.
Exchanges with the central server are by
means of PL/SQL-procedures.
Zentrale
Oracle
Datenbank
QualiMET admin
Server an der
Messnetzgruppe 1
Server an der
Messnetzgruppe 2
+ lokaler Client
Oracle 8i
Datenbank
Client
Client
Server an der
Messnetzgruppe 7
...
Oracle 8i
Datenbank
Oracle 8i
Datenbank
Client
Client
Client
Figure 2: QualiMET 3-layer-architecture
Layer 3, the client, visualises the data and
makes possible the interaction with the users.
The user starts the tests which will be carried out on the regional server. The communication between client and
regional server is by means of CORBA objects.
3.2 Checking the measurement and observation values
In order to check the measurements and observation data, currently some 120 individual test formulas are defined.
These are stored in the QualiMET database and can be administered using the software-component QualiMET-Admin.
The specified test conditions are converted by Admin into SQL statements which can be accessed during the testing
procedure via CORBA objects.
Individual stations and a specific period of time can be selected for the testing. Then the relevant data is loaded and the
test carried out in five stages:
Testing for completeness
Climatological tests
Checking consistency over time
Testing the inner consistency
Testing the spatial consistency
Suspected values can be presented in tabular form, or in a time-series or map window, and then corrected or confirmed.
3.3 Visualisation and processing of measurements and observation values
Figure 3 shows the main window of
QualiMET with the sub-division of tabular
window, time-series window and map
window.
For the presentation of the data in the table
and in the time series, the observer has the
opportunity to select the elements and the
stations to be displayed. However, the map
shows all the stations offering the elements
that have been selected. Data manipulation is
possible in all three presentation options. An
alteration in one of the windows automatically
leads to an up-date in the other forms of
presentation.
Figure 3: QualiMET - Main window
- Table
In the tabular window the presentations are
predominantly in numerical form. It is
possible to sort in terms of station, time or
elements, as well as to filter out particular
times. Missing values can either be added by
automatic interpolation or can be added
manually.
Figure 4 shows a tabular window with missing
data and with values of air temperature added
by linear interpolation.
Figure 4: QualiMET - Tabular window
- Time series
In the time series window, data can be presented
numerically, in graphs or bar diagrams or in the
form of symbols. Values in the time series
presentation can be manipulated by moving
individual points (by mouse grapping), by
moving selected parts in a time series, by the
interpolation of missing measurements, by
deleting selected values, or by accepting specific
measurements values.
Figure 5 shows a time-series window with 10minute values of relative humidity (bars), the air
temperature (lines) and the wind direction
(arrows) for two stations.
Figure 5: QualiMET - Time series window
Map
The map presentation makes it possible to select
various layers and background maps from a geodatabase.
In order to be able to present as many stations as
possible on the monitor screen, a zoom function
is included.
Figure 6 shows the map window with stations in
southern Germany. In order to be able to follow
changes over time in addition to the spatial
presentation, it is possible to present map sections
in various time steps.
Figure 6: QualiMET - Map window
For visual support when checking the data, presentations are possible with isolines or isosurfaces.
For the processing of the data within the map presentation a table window can be opened inside the map which contains
all the data available at the station for that point in time. Necessary corrections are made in this table and the effects are
shown immediately in the spatial presentation.
Figure 7a shows isosurfaces for relative humidity on 4 August 2000, 23.10 GMT, with an error for the
Weissenburg/Bay Station (50 %). This value is corrected in the table to 89%, and the result can be seen in Figure 7b.
Figure 7a:
Faulty value of
relative humidity
(50 %)
Figure 7b:
Corrected value of
relative humidity
(89 %)
4
Summary
With the new data control and monitoring system, in the future the DWD will be able to localise and remedy faults and
disturbances at the weather stations quickly and easily, as well as to find and correct faults in the data.
The present basis version of QualiMET will be optimised and extended in the coming years. For example, it is planned
to include radar and satellite images, but also the development of fully-automatic correction procedures.
The aim of the use of QualiMET is the continuous improvement of data collection and thus to increase and ensure the
quality of the data.


