http://stattrek
advertisement
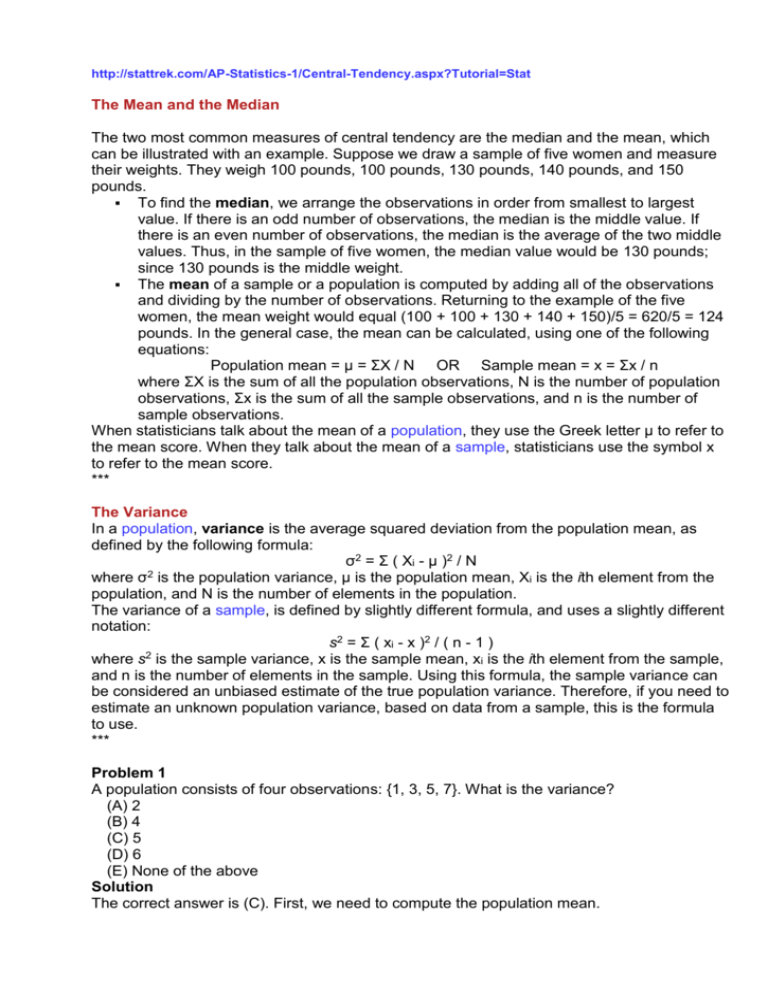
http://stattrek.com/AP-Statistics-1/Central-Tendency.aspx?Tutorial=Stat
The Mean and the Median
The two most common measures of central tendency are the median and the mean, which
can be illustrated with an example. Suppose we draw a sample of five women and measure
their weights. They weigh 100 pounds, 100 pounds, 130 pounds, 140 pounds, and 150
pounds.
To find the median, we arrange the observations in order from smallest to largest
value. If there is an odd number of observations, the median is the middle value. If
there is an even number of observations, the median is the average of the two middle
values. Thus, in the sample of five women, the median value would be 130 pounds;
since 130 pounds is the middle weight.
The mean of a sample or a population is computed by adding all of the observations
and dividing by the number of observations. Returning to the example of the five
women, the mean weight would equal (100 + 100 + 130 + 140 + 150)/5 = 620/5 = 124
pounds. In the general case, the mean can be calculated, using one of the following
equations:
Population mean = μ = ΣX / N OR Sample mean = x = Σx / n
where ΣX is the sum of all the population observations, N is the number of population
observations, Σx is the sum of all the sample observations, and n is the number of
sample observations.
When statisticians talk about the mean of a population, they use the Greek letter μ to refer to
the mean score. When they talk about the mean of a sample, statisticians use the symbol x
to refer to the mean score.
***
The Variance
In a population, variance is the average squared deviation from the population mean, as
defined by the following formula:
σ2 = Σ ( Xi - μ )2 / N
where σ2 is the population variance, μ is the population mean, Xi is the ith element from the
population, and N is the number of elements in the population.
The variance of a sample, is defined by slightly different formula, and uses a slightly different
notation:
s2 = Σ ( xi - x )2 / ( n - 1 )
2
where s is the sample variance, x is the sample mean, xi is the ith element from the sample,
and n is the number of elements in the sample. Using this formula, the sample variance can
be considered an unbiased estimate of the true population variance. Therefore, if you need to
estimate an unknown population variance, based on data from a sample, this is the formula
to use.
***
Problem 1
A population consists of four observations: {1, 3, 5, 7}. What is the variance?
(A) 2
(B) 4
(C) 5
(D) 6
(E) None of the above
Solution
The correct answer is (C). First, we need to compute the population mean.
μ=(1+3+5+7)/4=4
Then we plug all of the known values into formula for the variance of a population, as shown
below:
σ2 = Σ ( Xi - μ )2 / N
2
2
σ = [ ( 1 - 4 ) + ( 3 - 4 )2 + ( 5 - 4 )2 + ( 7 - 4 )2 ] / 4
σ2 = [ ( -3 )2 + ( -1 )2 + ( 1 )2 + ( 3 )2 ] / 4
σ2 = [ 9 + 1 + 1 + 9 ] / 4 = 20 / 4 = 5
***
http://ocw.mit.edu/OcwWeb/hs/com/LectureNotes/index.htm
http://www.sciencegems.com/math.html#4
http://www.mathpages.com/home/icombina.htm
http://mathforum.org/library/drmath/drmath.elem.html


