Boxplots
advertisement
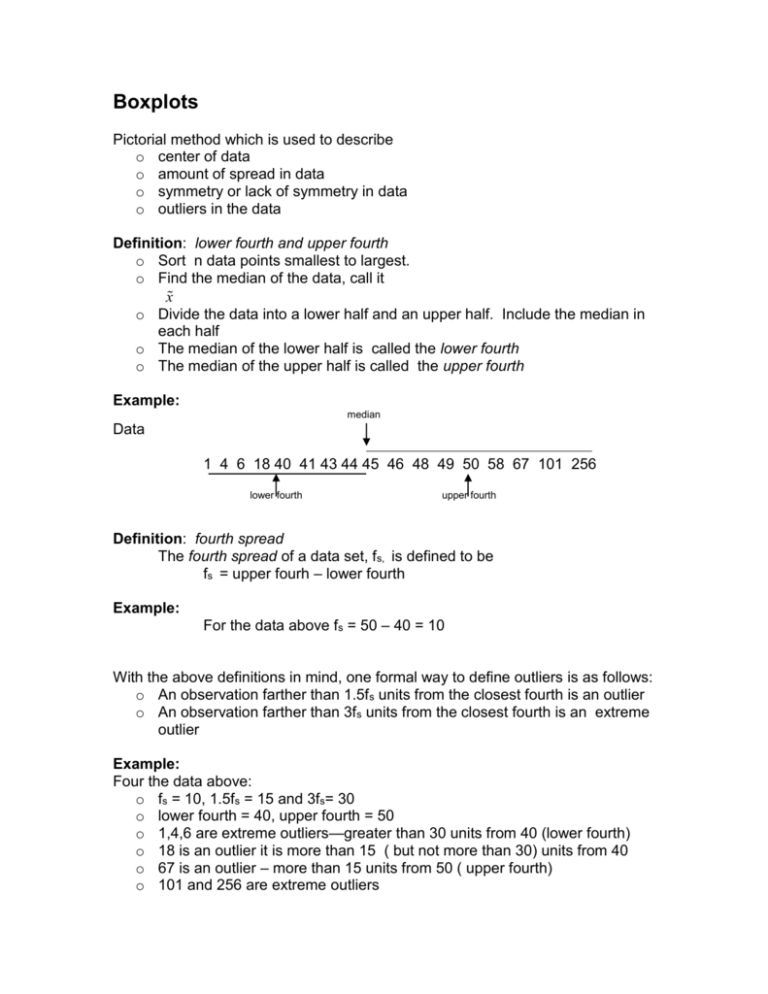
Boxplots Pictorial method which is used to describe o center of data o amount of spread in data o symmetry or lack of symmetry in data o outliers in the data Definition: lower fourth and upper fourth o Sort n data points smallest to largest. o Find the median of the data, call it x o Divide the data into a lower half and an upper half. Include the median in each half o The median of the lower half is called the lower fourth o The median of the upper half is called the upper fourth Example: median Data 1 4 6 18 40 41 43 44 45 46 48 49 50 58 67 101 256 lower fourth upper fourth Definition: fourth spread The fourth spread of a data set, fs, is defined to be fs = upper fourh – lower fourth Example: For the data above fs = 50 – 40 = 10 With the above definitions in mind, one formal way to define outliers is as follows: o An observation farther than 1.5fs units from the closest fourth is an outlier o An observation farther than 3fs units from the closest fourth is an extreme outlier Example: Four the data above: o fs = 10, 1.5fs = 15 and 3fs= 30 o lower fourth = 40, upper fourth = 50 o 1,4,6 are extreme outliers—greater than 30 units from 40 (lower fourth) o 18 is an outlier it is more than 15 ( but not more than 30) units from 40 o 67 is an outlier – more than 15 units from 50 ( upper fourth) o 101 and 256 are extreme outliers Minitab’s Version using the data from the example: o Minitab shows only 101 and 256 as extreme outliers. o Minitab shows only 2 outliers. Notice, eliminating the outliers, the spread below the median is grater than above the median. 0 100 200 C1 Text: Example 1.20 Radon Concentration –linked to childhood cancers Data: Radon Concentration in households in which a child has been diagnosed with cancer. (Measured in Bq/m3) Data : (stem and leaf) WITH WITHOUT Stem-and-leaf of With Leaf Unit = 1.0 1 7 17 (10) 15 8 7 5 0 0 1 1 2 2 3 3 HI N = 42 Stem-and-leaf of Without Leaf Unit = 1.0 3 567899 0001111233 5556667888 0112233 7 34 8 39, 45, 2 14 (9) 16 14 10 6 5 57, 210, 0 0 1 1 2 2 3 3 33 566777889999 111112234 77 1144 9999 3 89 HI 55, 55, 85, N = 39 Descriptive Statistics: Descriptive Statistics: With, Without Variable With Without N 42 39 Mean 22.81 19.15 Median 16.00 12.00 TrMean 17.97 17.17 Variable With Without Minimum 3.00 3.00 Maximum 210.00 85.00 Q1 10.75 8.00 Q3 22.25 29.00 StDev 31.66 16.99 SE Mean 4.88 2.72 With 200 100 0 With Without Note: o Both the mean and medians indicate or suggest that the concentration of radon in homes with diagnosed cancer is greater than those without cancer o The mean of the group with cancer is affected by the very extreme outlier , 210. The trimmed means are very close. o The standard deviations that there is more variation in the group with cancer. However, the fourth spread of the group without is greater than the fourth spread of the group with. Here the standard deviation was affected by the extreme outlier( 210) in the group with cancer
