Supplementary Information (doc 6673K)
advertisement
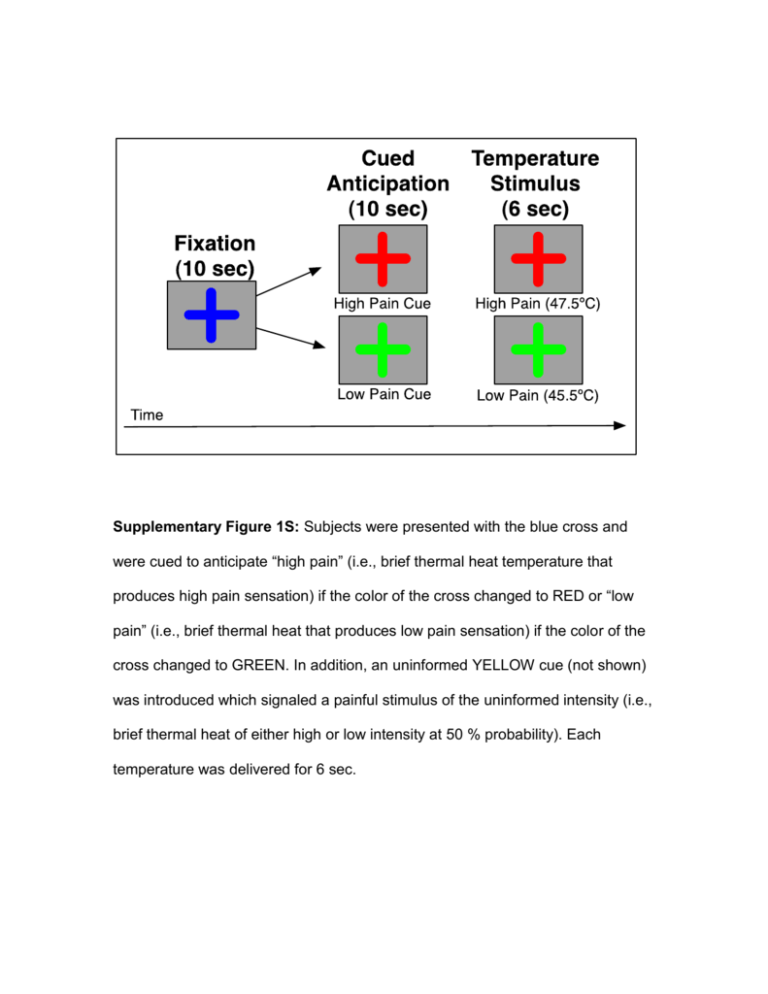
Supplementary Figure 1S: Subjects were presented with the blue cross and were cued to anticipate “high pain” (i.e., brief thermal heat temperature that produces high pain sensation) if the color of the cross changed to RED or “low pain” (i.e., brief thermal heat that produces low pain sensation) if the color of the cross changed to GREEN. In addition, an uninformed YELLOW cue (not shown) was introduced which signaled a painful stimulus of the uninformed intensity (i.e., brief thermal heat of either high or low intensity at 50 % probability). Each temperature was delivered for 6 sec. Experimental Paradigm: A total of 28 (14 high pain, 14 low pain) temperatures were delivered. High temperatures were preceded by the high anticipatory cue (i.e., cross changed from BLUE to RED) 7 times and by the uninformed cue (i.e., cross changed from BLUE to YELLOW) 7 times. Likewise low temperatures were preceded by low anticipatory cue (i.e., cross changed from BLUE to GREEN) 7 times and by the uninformed cue 7 times. Functional Connectivity Analyses: Data were preprocessed as for the main effects analyses with minor modifications aimed at removing non-specific physiological signals by band-pass filtering(0.009<ƒ<0.08). Individual time courses in these processed raw signal datasets were extracted for the seed ROIs within bilateral anterior insula(right AI, left AI from the anticipation task effects, Figure 1a) and from bilateral insular cortices(right IC, left IC from the pain task effects, Figure 2a). Data points were censored if they differed by more than two standard deviations from the average echoplanar signal for the given seed ROI. We then used AFNI function 3dTfitter to remove hemodynamic delay from the timecourses in the seed ROIs. The resultant signal in the seed ROIs was then multiplied by the respective regressors, i.e., right and left AI were multiplied by the anticipation regressor, while right and left IC were multiplied by the pain regressor. This created four interaction timecourses, which were then convolved with gamma-variate hemodynamic using the AFNI function waver. Four multiple linear regression models were run thereafter to examine connectivity of right and left anterior insula(AI) during pain anticipation and of right and left insular cortex(IC) during pain experience. The interaction timecourse was used as a regressor of interest in each model. Task regressors as well as regressors controlling for baseline differences, linear drift, head movement(roll, pitch, and yaw), and fluctuations in white matter signal were added to each regression model as nuissance variables. REML fitting was performed to reduce false positives due to timedependent cross correlations. The resulting correlation coefficient for the timecourse of interest was calculated for each voxel. This provided correlation maps for the timecourse in the seed ROIs and the timecourse from all other brain voxels as a function of pain anticipation or pain experience. The Fisher Z transforms of these correlation maps were then warped to conform to the Talairach atlas(45) to allow for group comparisons of the Fisher Z transforms in seed ROIs during pain anticipation and pain experience using independent twosample t-tests. This assessed differences in functional connectivity in right and left AI during pain anticipation and right and left IC during pain experience between MTBI and HC groups. Functional Connectivity Results Pain Anticipation(Supplementary Figure 2S): Using the right anterior insula time series during pain anticipation from the anticipation task effects(X/Y/Z:38/23/8;volume=4352mm3; see Supplementary Figure 2S, left panel) as a seed, four regions showed significant between group differences in functional connectivity with right AI(Figure 2S, Table 1S). Right orbitofrontal cortex(OFC) and right dorsolateral prefrontal cortex(dlPFC) showed increased connectivity, while ventromedial prefrontal cortex(vmPFC) and ventral anterior cingulate cortex(vACC) showed decreased connectivity during anticipation of pain in the MTBI group, in contrast to the HC group. Furthermore, using the left anterior insula time series during pain anticipation from the anticipation task effects(X/Y/Z:-32/24/10;volume=2688mm3; see Figure 2S, right panel) as a seed, three regions showed significant between group differences in functional connectivity with left AI(Figure 2S, Table 1S). The vmPFC, vACC and midbrain showed lower connectivity during anticipation of pain in the MTBI group, in contrast to the HC group. We found that only increased connectivity between right AI and OFC remained significantly different between the groups after covarying out traumatic and depressive symptoms severity. Pain Experience(Supplementary Figure 3S): Using the right insula time series from the pain experience task effects as a seed(X/Y/Z:38/6/10;volume=12160mm3; see Supplementary Figure 3S, left panel), several regions showed significant between group differences in functional connectivity with the right insula(Figure 3S, Table 2S). The vmPFC and one cluster within middle temporal gyrus showed increased connectivity, while right caudate, medial thalamus(with the peak on the left), and several clusters within the occipital lobe showed decreased connectivity during pain experience in the MTBI group, in contrasts with the HC group. Furthermore, using the left insula time series from the pain experience task effects as a seed(X/Y/Z:-41/4/7;volume=4608mm3; see Figure 3S, right panel), vmPFC, left IFG, left dlPFC and several temporal clusters showed increased connectivity and one occipital region showed decreased connectivity with left insula during pain experience in the MTBI compared to the HC group(Figure 3S, Table 2S). None of the observed group differences in connectivity during pain experience survived significance after co-varying out trauma and depressive symptoms severity. Figure 2S. Whole-Brain Between-Group Differences in Functional Connectivity with Anterior Insulas During Pain Anticipation. Left. Whole brain between group differences in functional connectivity using the right anterior insula(AI) time series during pain anticipation from the anticipation task effects(from Figure 1a) as a seed. Compared to HC, right orbitofrontal cortex(OFC) and right dorsolateral prefrontal cortex(dlPFC) showed increased connectivity, while ventromedial prefrontal cortex(vmPFC) and ventral anterior cingulate cortex(vACC) showed decreased connectivity during anticipation of pain in the MTBI group(see Table 1S for details); Increased connectivity between right AI and right OFC remained significant after controlling for anxiety and depression. Right. Whole brain between group differences in functional connectivity using the left anterior insula(AI) time series during pain anticipation from the anticipation task effects(from Figure 1a) as a seed. Compared to HC, vmPFC, vACC and midbrain showed decreased connectivity during anticipation of pain in the MTBI group(see Table 1S for details). Right=Left Figure 3S. Whole-Brain Between-Group Differences in Functional Connectivity with Mid-Posterior Insulas During Pain. Left. Whole brain between group differences in functional connectivity using the right insular cortex(IC) time series during pain experience from the pain experience task effects(from Figure 2a) as a seed. Compared to HC, vmPFC and one region within middle temporal gyrus showed increased connectivity, while right caudate, medial thalamus(with the peak on the left), and several regions within the occipital lobe showed decreased connectivity during pain experience in the MTBI group(see Table 2S for details). Right. Whole brain between group differences in functional connectivity using the left insular cortex(IC) time series during pain experience from the pain experience task effects(from Figure 2a) as a seed. Compared to HC, vmPFC, left IFG, left dlPFC and several temporal regions showed increased connectivity and one occipital region showed decreased connectivity with left insula during pain experience in the MTBI group(see Table 2S for details). Right=Left. TABLE 1S: Functional Connectivity with Anterior Insula: Between Group differences during Pain Anticipation (Whole Brain) Brain Region Right Anterior Insula Right Orbitofrontal Cortex Right dlPFC Left Middle Occipital Gyrus Right Fusiform Gyrus Right Cerebellum Left Cerebellum Left Anterior Insula No significant clusters vol x MTBI > HC 2368 1472 1344 1536 2048 1344 y 36 35 -30 34 40 -29 z stat 50 18 -80 -55 -60 -68 -1 39 -9 -16 -38 -36 2.7* 2.3 2.3 2.2 2.5 2.3 MTBI < HC Right Anterior Insula Left Anterior Cingulate(vACC) Right ventromedial PFC Left Precentral Gyrus Right Superior Temporal Gyrus Left Anterior Insula Left Anterior Cingulate (vACC) Right ventromedial PFC Right Midbrain 4160 1920 1280 1344 -3 1 -24 32 24 54 -27 16 -10 15 62 -30 2.6 2.6 2.4 2.4 2304 1280 1472 -6 2 1 29 54 -17 -13 14 -11 2.7 2.5 2.4 dlPFC – dorsolateral prefrontal; * - remained significant after controlling for traumatic and depressive symptoms severity and multiple comparison correction TABLE 2S: Functional Connectivity with Insula: Between Group differences during Pain Experience (Whole Brain) Brain Region Right Insula Left Middle Temporal Gyrus Right ventromedial PFC Left Insula Left ventromedial PFC Left dorsolateral PFC Left IFG/ventral AI Right Middle Temporal Gyrus Left Middle Temporal Gyrus vol x MTBI > HC y z stat 1984 1472 -60 -6 -23 55 -6 8 3 2.6 3264 1344 1344 2368 1344 5120 3904 -15 -28 -30 52 61 -49 -59 53 20 13 -2 -34 -58 -19 10 46 -18 -19 -8 24 -7 2.4 2.2 2.5 2.4 2.5 2.4 2.7 MTBI < HC Right Insula Right Fusiform Gyrus Left Lingual Gyrus Right Middle Occipital Gyrus Left Thalamus Right Caudate Left Insula Left Lingual Gyrus 2944 2560 2048 4928 1984 1920 1664 1536 37 47 17 -4 -10 24 -3 12 -68 -40 -65 -75 -92 -89 -15 22 -15 -17 -15 -9 0 7 -5 11 2.5 2.4 2.3 2.3 2.3 2.3 2.6 2.3 4032 -1 -74 -6 -2.3 PFC – prefrontal cortex, IFG/AI – inferior frontal gyrus/anterior insula
