“Variable parameter Muskingum-Cunge method
advertisement
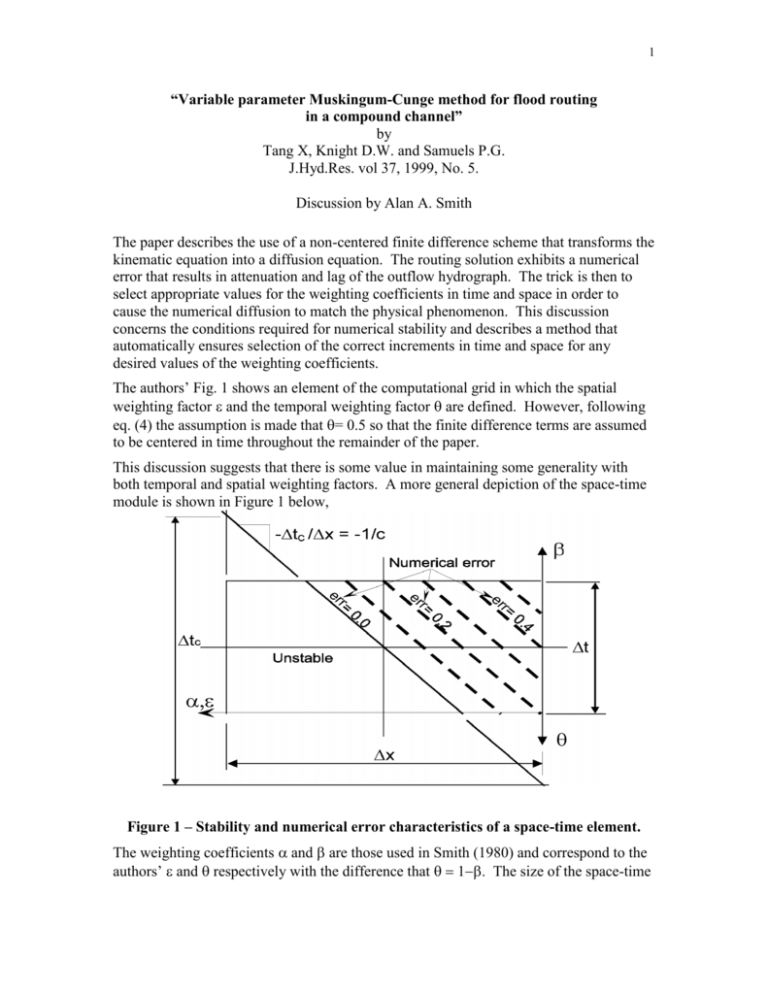
1 “Variable parameter Muskingum-Cunge method for flood routing in a compound channel” by Tang X, Knight D.W. and Samuels P.G. J.Hyd.Res. vol 37, 1999, No. 5. Discussion by Alan A. Smith The paper describes the use of a non-centered finite difference scheme that transforms the kinematic equation into a diffusion equation. The routing solution exhibits a numerical error that results in attenuation and lag of the outflow hydrograph. The trick is then to select appropriate values for the weighting coefficients in time and space in order to cause the numerical diffusion to match the physical phenomenon. This discussion concerns the conditions required for numerical stability and describes a method that automatically ensures selection of the correct increments in time and space for any desired values of the weighting coefficients. The authors’ Fig. 1 shows an element of the computational grid in which the spatial weighting factor and the temporal weighting factor are defined. However, following eq. (4) the assumption is made that = 0.5 so that the finite difference terms are assumed to be centered in time throughout the remainder of the paper. This discussion suggests that there is some value in maintaining some generality with both temporal and spatial weighting factors. A more general depiction of the space-time module is shown in Figure 1 below, Figure 1 – Stability and numerical error characteristics of a space-time element. The weighting coefficients and are those used in Smith (1980) and correspond to the authors’ and respectively with the difference that The size of the space-time 2 element is x wide and t high. The diagonal with slope -c defines the maximum time-step tc which is required to satisfy the Courant condition for numerical stability. Expressing the continuity equation as: 1 c A A 0 x t assuming zero lateral inflow q Biesenthal (1974) applied the Von Neumann method for analyzing errors and obtained the following condition for numerical stability. 2 1 Cr Cr 1 1 Cr 1 Cr 0 where Cr is the Courant stability number given by [3]. 3 Cr t t c c t x The absolute functions can be removed from the first and last terms of eq. [2] since 4 0.0 , 1.0 so that the criterion [2] becomes 5 1 2 1 2 Cr Cr 1 1 Cr 0 Examination of the four possible solutions to inequality [5] leads to the stability criterion 6 1 Cr 1 Figure 1 shows a case in which Cr is approximately equal to 0.5 and from [6] it follows that centering the finite differences in the region below and to the left of the main diagonal would result in an unstable solution. It is demonstrated later in this discussion that eq. [6] corresponds to the authors’ equation (37). Now for values of and that satisfy eq. [6] the error resulting from the imperfect centering can be expressed as follows. [7 ] Q A x 2 Q t 2 A 2 1 1 2 x t 2 x 2 2 t 2 x 2 3Q 1 3 3 2 1 3 3 2 3 6 x 2 t 2 3Q 2 x 2 2 xt 2 2 6t 3 A t 3 3 A x 2 t 2 0 Two conclusions emerge from [7]. (a) As the increments x and t reduce to zero the expression converges to the differential equation and is independent of the values of and 3 (b) As and depart from the central position of (0.5,0.5), truncation errors of the order O(x) and O(t) increase respectively and independently. Including only the first order terms in [7] it can be shown that the diffusion coefficient can be expressed as: [8] x t D 2 1 1 2 c 2 2 x 1 2 2 1Cr 2 By setting = 0.5 in eq. [8] and substituting for in the inequality [6] one obtains the more specific criteria of the authors’ eq. (37). This leads to the conclusion that a line parallel to the leading diagonal in Figure 1 represents the locus of a set of (,) coordinate pairs which will produce the same value of numerical error. Also, the error increases linearly as the lines approach the upper right corner of the space-time element defined by =0.0, =1.0. As mentioned by the authors, neglect of the convective and temporal acceleration terms in the St Venant equation allows the diffusion coefficient to be expressed in terms of channel characteristics. Thus: [9] D Q 2S dQ dh Q 2 BSc (see authors eq. (3)) Combining eqs. [8] and [9] provides a method for evaluating the weighting coefficients and to be evaluated for given channel characteristics. Thus [10] 1 2 2 1Cr Q h f dQ where h f S x dh A suitable algorithm to implement this scheme is summarized as follows. (a) Determine the diffusion coefficient from [9]. (b) Assume =0.5 and calculate maximum reach length xmax (from 1st & 2nd terms of [6]) and tmax (from 2nd & 3rd terms of [6]). (c) Subdivide x or t of space-time element into sub-multiples to ensure stability. For very long channels use a cascade of N channel segments each of length L/N. For very short channels use time-steps t = t/N. (d) Calculate from [8]. (e) If < 0.0 then set = 0.0 and compute in the range 0.5 ≤ ≤ 1.0 from [8]. (f) Compute the Muskingum-Cunge coefficients in terms of , and Cr, i.e. Note: C4 C1 C2 C3 4 [11] C1 1 Cr C 2 1 1 Cr C 3 Cr C 4 1 Cr where Cr c t x (g) Route the inflow through single or multiple reaches of the system using interpolation of the inflow in cases where t < t. The above algorithm has been implemented in the Miduss program since the initial DOS version over 10 years ago, however the channel cross-section was initially limited to a general trapezoidal shape. The more recent Windows version MIDUSS 98 added an option to allow the channel cross-section to be defined by straight segments joining up to 50 sets of coordinate pairs. (For details see Smith 1998). However, the algorithm was intended for relatively compact channel cross-sections in which the celerity can be approximated as 5/3 average velocity (from the Manning eq.). With this simplification the resulting outflow hydrograph does not exhibit any of the instabilities, volume loss or other anomalies discussed by the authors. Following publication of the authors’ paper, the writer modified the MIDUSS 98 program to allow the roughness coefficient (Manning ‘n’) to be specified for each segment of the cross-section. This allows modelling of the type of compound channel examined by the authors. Figure 2 – Typical result from the Channel command 5 When the ‘Variable roughness’ option is checked the conveyance of the channel is computed as the sum of the conveyance of each segment of the cross-section. The vertical division lines between all of the channel segments are assumed to have zero roughness. The method is therefore similar to the ‘Vertical division method (VD)’ described by the authors and presumably suffers from the same drawbacks. Figure 2 shows the results of the Channel command for the Ackers channel (p.598) with a slope of 0.03% (S=0.0003) and with a peak flow of 100 c.m/s. Using the bed slopes in the authors’ Table 2 the computed normal depth is shown in column 2 of Table 1 below. It would be interesting to know if the methods used by the authors to subdivide the crosssection resulted in significantly different depths. Table 1 – MIDUSS 98 results using asymmetric inflow hydrograph (Qpeak = 100 c.m/s; Qbase = 10 c.m.s; x = 1000 m; t = 30 min) Channel bedslope Normal depth (%) (m) 0.3 1.959 0.1 0.05 0.03 2.495 2.916 3.282 MIDUSS98 outflow Tpeak Qpeak Volume (hours) (c.m/s loss (%) 18.0 99.865 <0.001 (18.5) (99.70) (0.86) 20.0 98.487 <0.003 (19.5) (98.37) (0.95) 21.5 94.189 <0.006 (21.0) (93.96) (0.47) 23.0 85.772 <0.018 (22.5) (85.54) (1.37) The other columns in Table 1 show the result of applying the ‘Route’ command. For convenience the authors’ results are shown below each value in parentheses. For this experiment the Route command was modified to allow the number of subreaches to be modified to force the computed value of x to be changed. Also, the ratio c/V could be adjusted to test the sensitivity of the results to the fixed wave celerity. The number of sub-reaches was set to 20 to match the authors’ test. It was found that using a value of c/V = 0.97 produced results acceptably close to those of the authors. The loss of volume is negligible, the small percentage loss values shown in Table 1 being due mainly to truncation of the hydrographs at 60 hours. The four outflow hydrographs are shown in Figure 3 below. These do not display the plateau in the rising limb that the authors obtained (Fig. 5). The authors suggest that this should occur when the inflow reaches the bankfull value so that any increase in inflow is absorbed in floodplain storage that does not contribute to outflow until the shallow wave has traveled down the entire length of the floodplain. Simulation of this phenomenon appears to require that celerity c is varied with flow Q. However, the authors’ computed c = f(Q) curve (Fig. 3) appears to be computed by treating the compound cross-section as a whole. 6 Now for the data used for the authors’ Figure 3 and for a depth of 1.55m (i.e. a flood plain depth of 50 mm) the celerity in the main channel is approximately 3.3 m/s whereas the celerity on the floodplain is close to 0.25 m/s. Averaging the properties of the compound channel the celerity is about 1.8 m/s. Also for channel depth y = 1.55 m the flow in the channel is 60 c.m/s compared to an overbank flow of 0.5 c.m/s. The question then arises as to whether the averaging process used to compute the function c = f(Q) might affect the appearance of the plateau in the rising curve of the outflow hydrograph. Do the authors know of any corroborative evidence - either observed or simulated - to support this finding? Figure 3 – Inflow and Outflow hydrographs referenced in Table 1. In conclusion the authors are to be congratulated on extending the scope of the Muskingum-Cunge method to treat the complex question of a compound channel crosssection with encouraging results. It is hoped that this discussion may encourage use of both space and time weighting factors to allow spatial discretisation to be computed as a function of the time step and the channel hydraulic characteristics. This may help to reduce the instabilities in the recession limb. References Biesenthal, F.M. 1974 “A generalized approach to kinematic flood routing.” M.Eng Thesis, McMaster University, Hamilton, Ont. Smith,A.A. 1998, MIDUSS 98 User Manual – Chap.8, http://www.alanasmith.com

