In the last 10 years prompt neutron emission models based on Los
advertisement
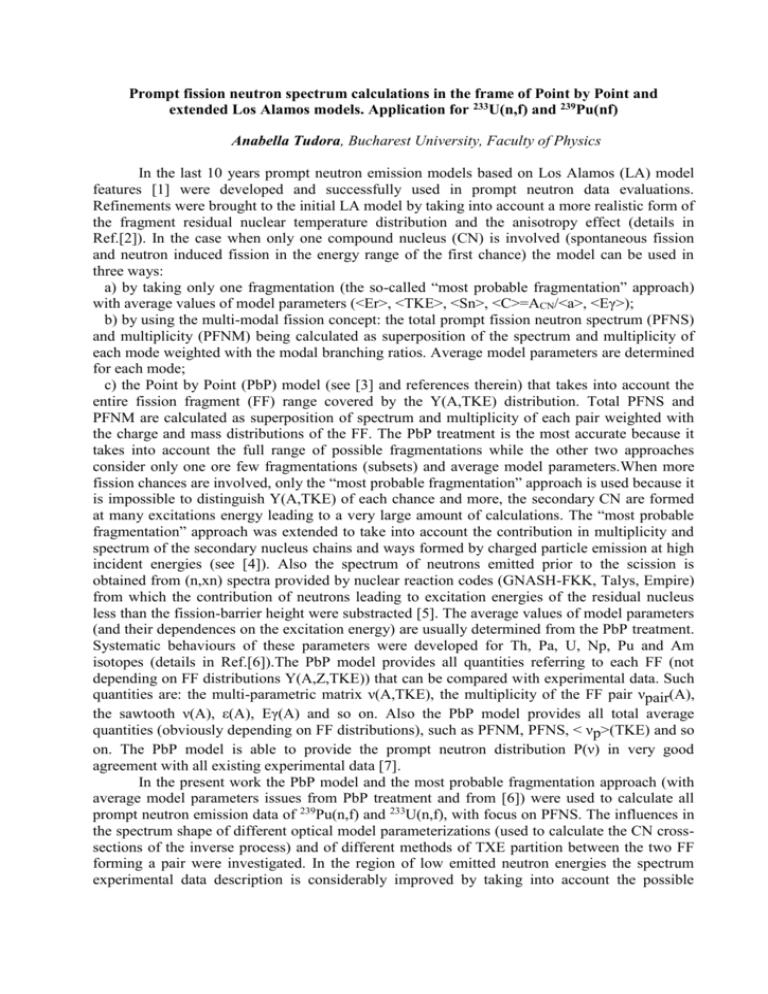
Prompt fission neutron spectrum calculations in the frame of Point by Point and extended Los Alamos models. Application for 233U(n,f) and 239Pu(nf) Anabella Tudora, Bucharest University, Faculty of Physics In the last 10 years prompt neutron emission models based on Los Alamos (LA) model features [1] were developed and successfully used in prompt neutron data evaluations. Refinements were brought to the initial LA model by taking into account a more realistic form of the fragment residual nuclear temperature distribution and the anisotropy effect (details in Ref.[2]). In the case when only one compound nucleus (CN) is involved (spontaneous fission and neutron induced fission in the energy range of the first chance) the model can be used in three ways: a) by taking only one fragmentation (the so-called “most probable fragmentation” approach) with average values of model parameters (<Er>, <TKE>, <Sn>, <C>=ACN/<a>, <Eγ>); b) by using the multi-modal fission concept: the total prompt fission neutron spectrum (PFNS) and multiplicity (PFNM) being calculated as superposition of the spectrum and multiplicity of each mode weighted with the modal branching ratios. Average model parameters are determined for each mode; c) the Point by Point (PbP) model (see [3] and references therein) that takes into account the entire fission fragment (FF) range covered by the Y(A,TKE) distribution. Total PFNS and PFNM are calculated as superposition of spectrum and multiplicity of each pair weighted with the charge and mass distributions of the FF. The PbP treatment is the most accurate because it takes into account the full range of possible fragmentations while the other two approaches consider only one ore few fragmentations (subsets) and average model parameters.When more fission chances are involved, only the “most probable fragmentation” approach is used because it is impossible to distinguish Y(A,TKE) of each chance and more, the secondary CN are formed at many excitations energy leading to a very large amount of calculations. The “most probable fragmentation” approach was extended to take into account the contribution in multiplicity and spectrum of the secondary nucleus chains and ways formed by charged particle emission at high incident energies (see [4]). Also the spectrum of neutrons emitted prior to the scission is obtained from (n,xn) spectra provided by nuclear reaction codes (GNASH-FKK, Talys, Empire) from which the contribution of neutrons leading to excitation energies of the residual nucleus less than the fission-barrier height were substracted [5]. The average values of model parameters (and their dependences on the excitation energy) are usually determined from the PbP treatment. Systematic behaviours of these parameters were developed for Th, Pa, U, Np, Pu and Am isotopes (details in Ref.[6]).The PbP model provides all quantities referring to each FF (not depending on FF distributions Y(A,Z,TKE)) that can be compared with experimental data. Such quantities are: the multi-parametric matrix ν(A,TKE), the multiplicity of the FF pair νpair(A), the sawtooth ν(A), ε(A), Eγ(A) and so on. Also the PbP model provides all total average quantities (obviously depending on FF distributions), such as PFNM, PFNS, < νp>(TKE) and so on. The PbP model is able to provide the prompt neutron distribution P(ν) in very good agreement with all existing experimental data [7]. In the present work the PbP model and the most probable fragmentation approach (with average model parameters issues from PbP treatment and from [6]) were used to calculate all prompt neutron emission data of 239Pu(n,f) and 233U(n,f), with focus on PFNS. The influences in the spectrum shape of different optical model parameterizations (used to calculate the CN crosssections of the inverse process) and of different methods of TXE partition between the two FF forming a pair were investigated. In the region of low emitted neutron energies the spectrum experimental data description is considerably improved by taking into account the possible Ratio to Maxwellian TM=2<E>/3 scission neutron contribution (with an amount of <νSCN>/<νp>=1.1%, according to [8]). Two examples of PFNS calculations are given in the following figures. 0 1 2 3 4 5 6 7 8 9 10 11 12 13 14 15 1.3 1.2 233 U(nth,f) 1.1 1.0 0.9 present calculation 0.8 using: 0.7 E*L/E*H=L/H, Becchetti-Greenless 0.6 exp.Y(A,TKE) IRMM and Wagemans 0.5 1.2 1.1 1.0 0.9 0.8 Starostov 83 RUSNIR given in EXFOR as ratio 252Cf(SF) 0.7 Lajtay 85 HUNKFI Nefedov 83 RUSNIR 0.6 Bojcov 83 CCPNIR Starostov 83 RUSNIR 0.5 -2 -1 0 1 10 10 10 E (MeV) 10 Ratio to Maxwellian TM=2*<E>/3 Fig.1: 233U(nth,f) spectrum calculation in comparison with experimental data taken from EXFOR. 0 1 2 3 4 5 6 7 8 9 10 11 12 13 14 15 1.3 239 present calculation 1.2 Pu(nth,f) E*L/E*H = L/H, Becchetti-Gr., SCN 1.1% 1.1 1.0 0.9 0.8 Bojkov 86 CCPNIR 0.7 , , Nefedov 83 RUSNIR , Starostov 83 RUSNIR 0.6 0.5 1.2 1.1 1.0 0.9 0.8 Bojkov 86 CCPNIR present calculation , , Nefedov 83 RUSNIR 0.7 E*L/E*H = L/H, Becchetti-Gr., SCN 1.1% , Starostov 83 RUSNIR 0.6 0.5 -2 -1 0 1 10 10 10 10 E(MeV) Fig.2: 239Pu(nth,f) spectrum calculation in comparison with experimental data taken from EXFOR References 1. D.G.Madland, J.R.Nix, Nucl.Sci.Eng.81 (1982) 213 2. F.-J.Hambsch, A.Tudora, G.Vladuca, S.Oberstedt, Ann.Nucl.Energy 32 (2005) 1032 3. A.Tudora, Ann.Nucl.Energy 35 (2008) 1 4. A.Tudora, G.Vladuca, B.Morillon, Nucl.Phys.A 740 (2004) 33 5. A.Tudora, B.Morillon, F.-J.Hambsch, G.Vladuca, S.Oberstedt, Nucl.Phys.A 756 (2005) 176 6. A.Tudora, Ann.Nucl.Energy 36 (2009) 72 7. A.Tudora, F.-J.Hambsch, Ann.Nucl.Energy 37 (2010) 771 8. C. Wagemans, “The Nuclear Fission Process”, 1991, CRC Press, Boca Raton, Chapter 11, pp.507

