How to write up a laboratory investigation
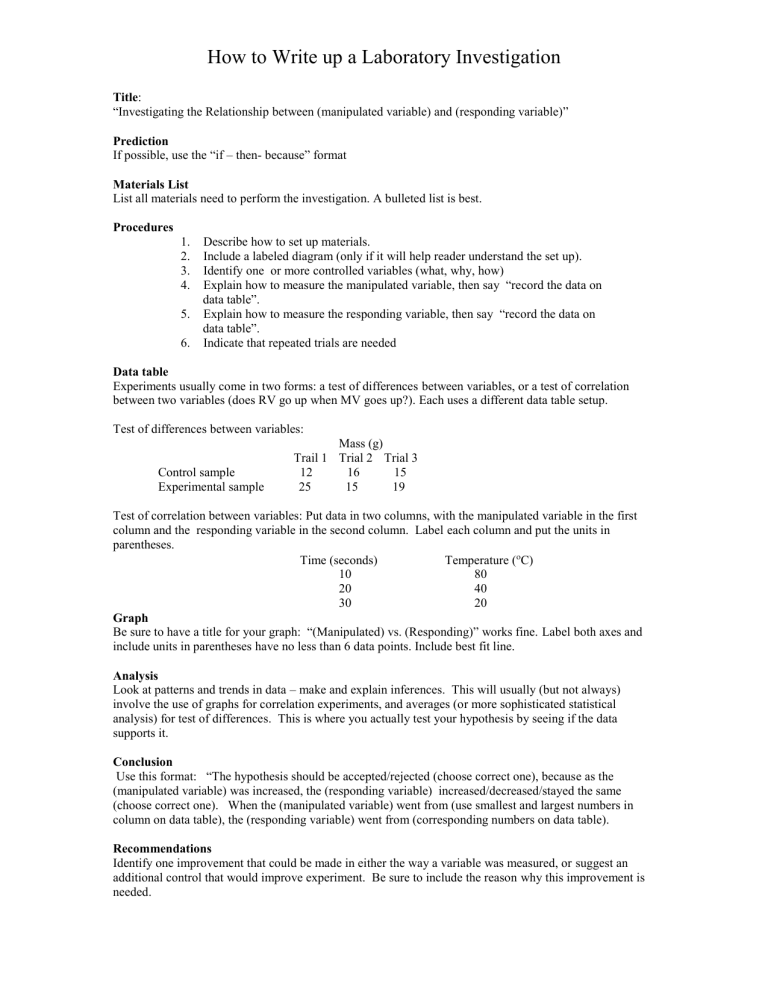
How to Write up a Laboratory Investigation
Title :
“Investigating the Relationship between (manipulated variable) and (responding variable)”
Prediction
If possible, use the “if – then- because” format
Materials List
List all materials need to perform the investigation. A bulleted list is best.
Procedures
1.
Describe how to set up materials.
2.
Include a labeled diagram (only if it will help reader understand the set up).
3.
Identify one or more controlled variables (what, why, how)
4.
Explain how to measure the manipulated variable, then say “record the data on
data table”.
5.
Explain how to measure the responding variable, then say “record the data on
data table”.
6.
Indicate that repeated trials are needed
Data table
Experiments usually come in two forms: a test of differences between variables, or a test of correlation between two variables (does RV go up when MV goes up?). Each uses a different data table setup.
Test of differences between variables:
Mass (g)
Control sample
Trail 1 Trial 2 Trial 3
12 16 15
Experimental sample 25 15 19
Test of correlation between variables: Put data in two columns, with the manipulated variable in the first column and the responding variable in the second column. Label each column and put the units in parentheses.
Time (seconds)
10
20
30
Temperature (
C)
80
40
20
Graph
Be sure to have a title for your graph: “(Manipulated) vs. (Responding)” works fine. Label both axes and include units in parentheses have no less than 6 data points. Include best fit line.
Analysis
Look at patterns and trends in data – make and explain inferences. This will usually (but not always) involve the use of graphs for correlation experiments, and averages (or more sophisticated statistical analysis) for test of differences. This is where you actually test your hypothesis by seeing if the data supports it.
Conclusion
Use this format: “The hypothesis should be accepted/rejected (choose correct one), because as the
(manipulated variable) was increased, the (responding variable) increased/decreased/stayed the same
(choose correct one). When the (manipulated variable) went from (use smallest and largest numbers in column on data table), the (responding variable) went from (corresponding numbers on data table).
Recommendations
Identify one improvement that could be made in either the way a variable was measured, or suggest an additional control that would improve experiment. Be sure to include the reason why this improvement is needed.

