Interpreting Center 1 ANS
advertisement
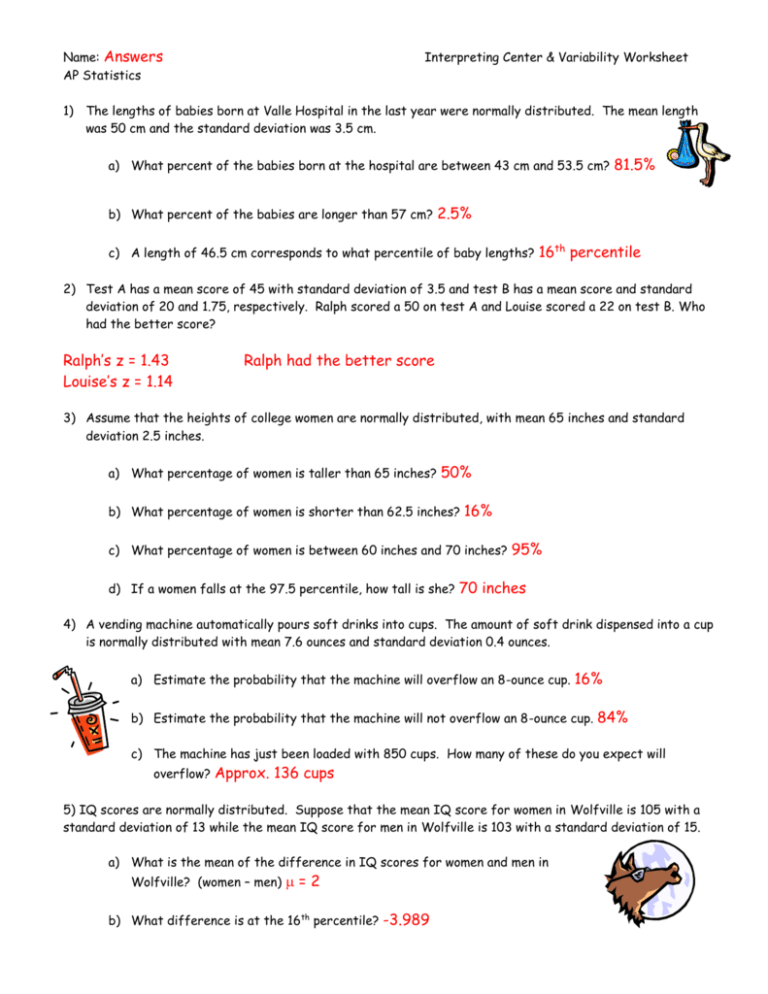
Name: Answers AP Statistics Interpreting Center & Variability Worksheet 1) The lengths of babies born at Valle Hospital in the last year were normally distributed. The mean length was 50 cm and the standard deviation was 3.5 cm. a) What percent of the babies born at the hospital are between 43 cm and 53.5 cm? b) What percent of the babies are longer than 57 cm? 81.5% 2.5% c) A length of 46.5 cm corresponds to what percentile of baby lengths? 16th percentile 2) Test A has a mean score of 45 with standard deviation of 3.5 and test B has a mean score and standard deviation of 20 and 1.75, respectively. Ralph scored a 50 on test A and Louise scored a 22 on test B. Who had the better score? Ralph’s z = 1.43 Louise’s z = 1.14 Ralph had the better score 3) Assume that the heights of college women are normally distributed, with mean 65 inches and standard deviation 2.5 inches. a) What percentage of women is taller than 65 inches? 50% b) What percentage of women is shorter than 62.5 inches? 16% c) What percentage of women is between 60 inches and 70 inches? d) If a women falls at the 97.5 percentile, how tall is she? 95% 70 inches 4) A vending machine automatically pours soft drinks into cups. The amount of soft drink dispensed into a cup is normally distributed with mean 7.6 ounces and standard deviation 0.4 ounces. a) Estimate the probability that the machine will overflow an 8-ounce cup. 16% b) Estimate the probability that the machine will not overflow an 8-ounce cup. 84% c) The machine has just been loaded with 850 cups. How many of these do you expect will overflow? Approx. 136 cups 5) IQ scores are normally distributed. Suppose that the mean IQ score for women in Wolfville is 105 with a standard deviation of 13 while the mean IQ score for men in Wolfville is 103 with a standard deviation of 15. a) What is the mean of the difference in IQ scores for women and men in Wolfville? (women – men) =2 b) What difference is at the 16th percentile? -3.989
