What is effect size? - the Department of Psychology at Illinois State
advertisement
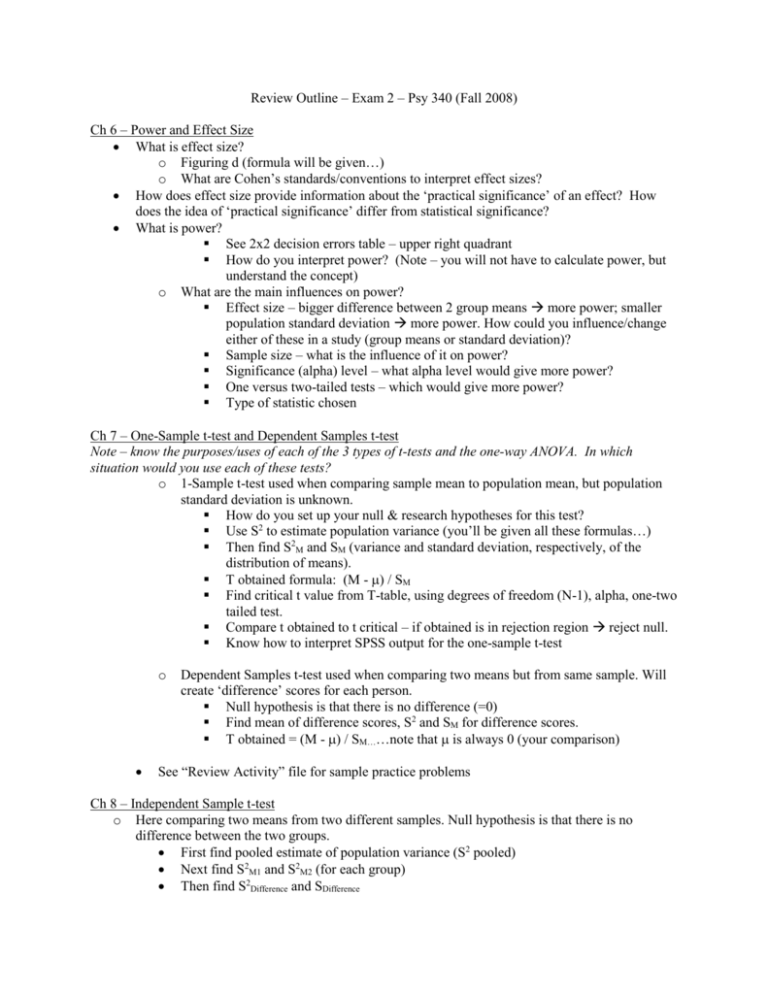
Review Outline – Exam 2 – Psy 340 (Fall 2008) Ch 6 – Power and Effect Size What is effect size? o Figuring d (formula will be given…) o What are Cohen’s standards/conventions to interpret effect sizes? How does effect size provide information about the ‘practical significance’ of an effect? How does the idea of ‘practical significance’ differ from statistical significance? What is power? See 2x2 decision errors table – upper right quadrant How do you interpret power? (Note – you will not have to calculate power, but understand the concept) o What are the main influences on power? Effect size – bigger difference between 2 group means more power; smaller population standard deviation more power. How could you influence/change either of these in a study (group means or standard deviation)? Sample size – what is the influence of it on power? Significance (alpha) level – what alpha level would give more power? One versus two-tailed tests – which would give more power? Type of statistic chosen Ch 7 – One-Sample t-test and Dependent Samples t-test Note – know the purposes/uses of each of the 3 types of t-tests and the one-way ANOVA. In which situation would you use each of these tests? o 1-Sample t-test used when comparing sample mean to population mean, but population standard deviation is unknown. How do you set up your null & research hypotheses for this test? Use S2 to estimate population variance (you’ll be given all these formulas…) Then find S2M and SM (variance and standard deviation, respectively, of the distribution of means). T obtained formula: (M - ) / SM Find critical t value from T-table, using degrees of freedom (N-1), alpha, one-two tailed test. Compare t obtained to t critical – if obtained is in rejection region reject null. Know how to interpret SPSS output for the one-sample t-test o Dependent Samples t-test used when comparing two means but from same sample. Will create ‘difference’ scores for each person. Null hypothesis is that there is no difference (=0) Find mean of difference scores, S2 and SM for difference scores. T obtained = (M - ) / SM……note that is always 0 (your comparison) See “Review Activity” file for sample practice problems Ch 8 – Independent Sample t-test o Here comparing two means from two different samples. Null hypothesis is that there is no difference between the two groups. First find pooled estimate of population variance (S2 pooled) Next find S2M1 and S2M2 (for each group) Then find S2Difference and SDifference o T obtained = (M1 – M2) / S difference Use t table to find critical t, note that df = N-2. Compare t obtained and t critical – if obtained is in rejection region reject null What is the harmonic mean (conceptually)? Why do we sometimes need to figure it? o Know how to interpret SPSS output for the independent samples t-test. Remember that SPSS checks the assumption of equal group variances via Leven’s test first. First check whether the assumption of equal group variances is true or false. Then follow the appropriate line to get your output for the obtained t and test the null hypothesis of equal group means. o See “Review Activity” file for a sample practice problem and SPSS output Ch. 9 – Introduction to ANOVA When is ANOVA used? Testing differences between means of more than 2 groups o What is the null hypothesis? No group differences (all means are equal) Focus on estimating 2 sources of variance in scores: o Within-groups estimate of population variance Why would scores vary based on within-group variance? o Between-groups estimate of population variance Why would scores vary based on between-group variance? Concept of the F ratio (Between groups variance / Within groups variance) How do you carry out an ANOVA with equal group sizes? o Find within-groups variance: start with estimates of each group’s variance (S2), then average those estimates to get S2within aka MS within (see formula in chapter). o Find between-groups variance: start with estimate of variance of the distribution of means (S2M); first find Grand Mean (GM), then subtract GM from each group mean and square that deviation, then add all deviation scores: S2M = [ (M – GM)2] / Number of groups – 1. o Next, use S2M and multiply by group size …this gives you S2 Between aka MS Between. o Finally, find F obtained by using MS within and between: F obtained = MS Between / MS Within Compare to F critical where DF numerator = Number of groups – 1 and DF denominator = (n1 – 1) + (n2 – 1) + (n3 – 1) + …. If F obtained > F critical reject null Planned Comparisons are next…if you find a significant overall F test, need to follow-up to determine which groups differ. o Be familiar with the concept of planned comparisons – the F test is re-estimated (your MS within will not change, but MS Between will change because we are only using the two groups of interest). You won’t have to calculate planned comparisons, but understand the concept. Bonferroni correction – why/when do you need to do this? How does it control the Type 1 error rate? o What do you divide your alpha level by to make the correction? o What do you do with this new/adjusted alpha level? Effect size in ANOVA is R2 or 2 (eta-squared)…what does it mean? Suggested practice problem for this chapter is #5 (parts a and c only) ** Integration – be sure that you can identify which of the 3 t-tests (1-sample, dependent samples, independent samples) would be the most appropriate test given a description of a study. Also be able to distinguish between situations when you should use a 1-sample z test versus a 1-sample t test (depends on whether the population variance is known!) and the benefit to using an ANOVA rather than multiple independent samples t-tests.
