Appendix: Bayesian Methods for estimating prior probabilites
advertisement
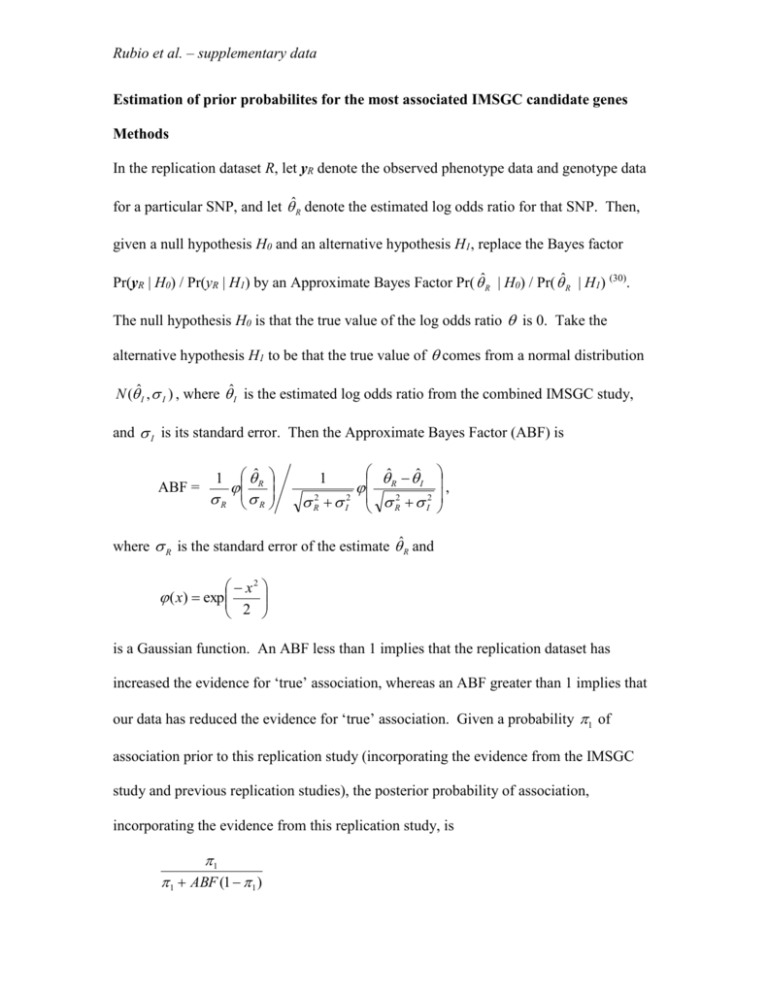
Rubio et al. – supplementary data Estimation of prior probabilites for the most associated IMSGC candidate genes Methods In the replication dataset R, let yR denote the observed phenotype data and genotype data for a particular SNP, and let ˆR denote the estimated log odds ratio for that SNP. Then, given a null hypothesis H0 and an alternative hypothesis H1, replace the Bayes factor Pr(yR | H0) / Pr(yR | H1) by an Approximate Bayes Factor Pr( ˆR | H0) / Pr( ˆR | H1) (30). The null hypothesis H0 is that the true value of the log odds ratio is 0. Take the alternative hypothesis H1 to be that the true value of comes from a normal distribution N (ˆI , I ) , where ˆI is the estimated log odds ratio from the combined IMSGC study, and I is its standard error. Then the Approximate Bayes Factor (ABF) is ABF = 1 R ˆR R 1 R2 I2 ˆ ˆ R I 2 2 R I , where R is the standard error of the estimate ˆR and x2 ( x) exp 2 is a Gaussian function. An ABF less than 1 implies that the replication dataset has increased the evidence for ‘true’ association, whereas an ABF greater than 1 implies that our data has reduced the evidence for ‘true’ association. Given a probability 1 of association prior to this replication study (incorporating the evidence from the IMSGC study and previous replication studies), the posterior probability of association, incorporating the evidence from this replication study, is 1 1 ABF (1 1 ) Rubio et al. – supplementary data This is equal to one minus the Bayesian False Discovery Probability (BFDP) (30). For the seven most associated non-HLA SNPs (six genes) in the IMSGC study, posterior probabilities were calculated for prior probabilities 1 of 0.99, 0.95, 0.9, 0.7, 0.5 and 0.3, respectively. Results A summary of the results is presented in the text of the manuscript. Below is a more in depth description of the data for each of seven SNPs represented in Table 2. For KIAA0350 (rs6498169), the ABF was 0.008, and if, for example, the prior probability of this association were 0.5 before our data were added (i.e. an evens, or 1:1, chance), the posterior probability of this association being ‘true’ now might be 0.992 (or odds of about 100:1 in favour), where the odds of association = probability of association/(1 probability of association). For IL2RA, there is more prior evidence that this association is ‘true’, and thus the current prior probability for this locus might be greater than for KIAA0350 i.e. 0.9 or odds of 9:1 in favour. We found that the ABF for rs12722489 (a SNP that did not reach our p≤0.05 significance threshold) was 0.714, and thus if this scenario were true, we would still have contributed to an increase in the posterior probability from 0.9 to 0.927. In contrast, the more associated IL2RA SNP (rs2104286), with an ABF of 0.119, would have contributed much more to the posterior probability of this association being ‘true’ (now 0.987, or odds of nearly 100:1). If we assume that the less significant p-values achieved by the IMSGC for RPL5 and CD58 meant that the prior probabilities for these loci being truly associated with risk were less than for the other more highly ‘ranked’ genes (e.g. prior probabilities of 0.3, or Rubio et al. – supplementary data odds of around 1:2 against them being truly associated) then our data has increased the posterior probabilities to 0.724 and 0.721, respectively, now 3:1 in favour of these associations being ‘true’. Our failure to replicate the association with the IL7R SNP (rs6897932) and its correspondingly high ABF of 33.54 diminish the posterior probability for this association. However, there is more supporting evidence for IL7R being a ‘true’ MS susceptibility locus than for any other non-HLA gene (6-8, 10), so the prior probability for this locus might have been 0.99 prior to this study. If this were the case, then the posterior probability of this association would now be 0.747, still about 3:1 in favour of this locus being a bone fide MS susceptibility locus.


