Part One – Linear Regression: Prediction (Chapter 6)
advertisement
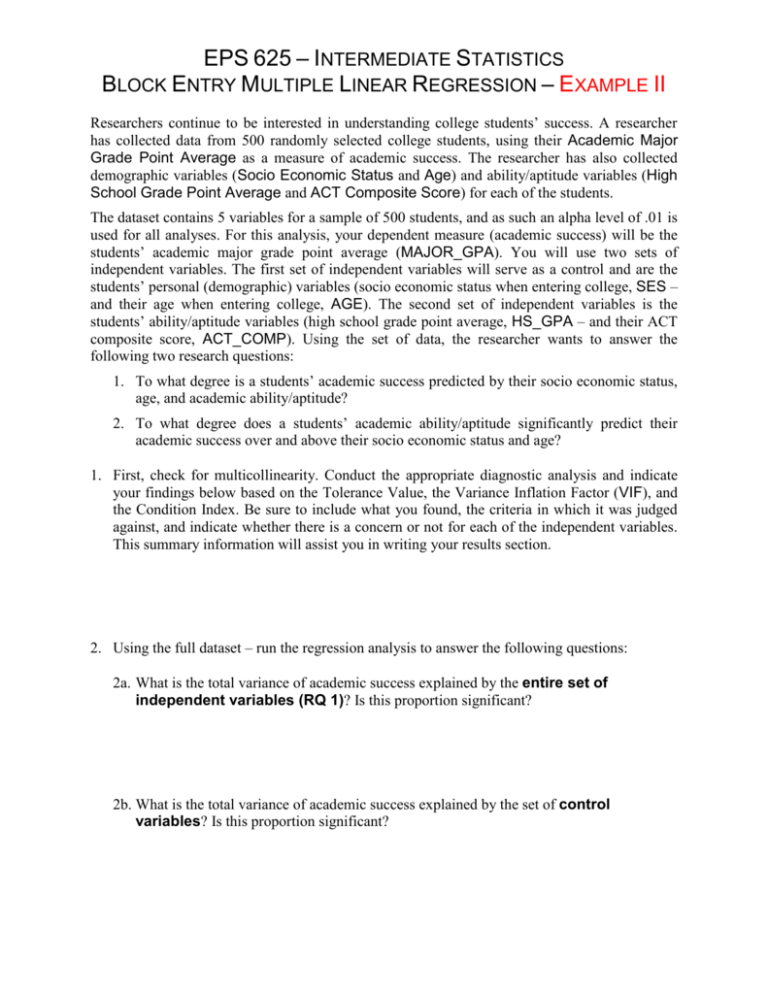
EPS 625 – INTERMEDIATE STATISTICS BLOCK ENTRY MULTIPLE LINEAR REGRESSION – EXAMPLE II Researchers continue to be interested in understanding college students’ success. A researcher has collected data from 500 randomly selected college students, using their Academic Major Grade Point Average as a measure of academic success. The researcher has also collected demographic variables (Socio Economic Status and Age) and ability/aptitude variables (High School Grade Point Average and ACT Composite Score) for each of the students. The dataset contains 5 variables for a sample of 500 students, and as such an alpha level of .01 is used for all analyses. For this analysis, your dependent measure (academic success) will be the students’ academic major grade point average (MAJOR_GPA). You will use two sets of independent variables. The first set of independent variables will serve as a control and are the students’ personal (demographic) variables (socio economic status when entering college, SES – and their age when entering college, AGE). The second set of independent variables is the students’ ability/aptitude variables (high school grade point average, HS_GPA – and their ACT composite score, ACT_COMP). Using the set of data, the researcher wants to answer the following two research questions: 1. To what degree is a students’ academic success predicted by their socio economic status, age, and academic ability/aptitude? 2. To what degree does a students’ academic ability/aptitude significantly predict their academic success over and above their socio economic status and age? 1. First, check for multicollinearity. Conduct the appropriate diagnostic analysis and indicate your findings below based on the Tolerance Value, the Variance Inflation Factor (VIF), and the Condition Index. Be sure to include what you found, the criteria in which it was judged against, and indicate whether there is a concern or not for each of the independent variables. This summary information will assist you in writing your results section. 2. Using the full dataset – run the regression analysis to answer the following questions: 2a. What is the total variance of academic success explained by the entire set of independent variables (RQ 1)? Is this proportion significant? 2b. What is the total variance of academic success explained by the set of control variables? Is this proportion significant? 2c. What is the total variance of academic success explained by the set of ability/aptitude variables (RQ 2)? Is this proportion significant? 3. Of the four independent variables, which ones (if any) have a significant influence on the dependent measure? Indicate how you made your determination. 4. List the independent variables based on their relative importance from greatest to least influence. Indicate how you made your determination. Be careful on the selection. 5. Choose any one of the significant independent variables from the full model (Model 2) and briefly explain its relationship with the dependent measure. Don’t forget – you will want to be looking at its beta coefficient. 6. Using the multiple regression straight line equation, predict a student’s performance on the statistics exam, given the following information: SES 3.50 Age 19 High School GPA 3.50 Act Composite 24 7. Write a results section for this analysis. Your result section should be similar to the in-class example (using APA guidelines), including the two tables and the complete narrative. Be sure to use the example as a guide so as to not loose points. Complete Table 1 and Table 2, using two (2) decimal places. Don’t forget to put asterisks where applicable on Table 2 (showing significance). BLOCK ENTRY MLR EXAMPLE II PAGE 2 Results Ordinary least squares multiple regression was used to determine to what degree students’ socio economic status, age, high school grade point average, and ACT composite score were significant predictors (measures of influence) on students’ academic success. Additionally, the analysis investigated whether students’ high school grade point average and ACT composite score contribute significantly over and above their socio economic status and age on their academic success? The first set of independent variables included 1) SES – the students’ socio economic status when entering college and 2) Age – the students’ age when entering college. This first set of variables served as the control variables. The second set of independent variables included 1) Students’ high school grade point average and 2) Students’ ACT composite score. The dependent variable was the students’ academic success, as measured by their academic major grade point average. The sample for this study consisted of 500 randomly selected students who attended and subsequently graduated from a mid-sized regional university. With a sample size of 500 students, an alpha level of .01 was used for all analyses. Preliminary examination of the results indicated that there was no extreme multicollinearity in the data. Using Stevens’ (2002) established criteria for determination, exploratory data analyses were conducted to test the assumptions of regression and to determine if there were any outliers and/or potentially influential data points for which none were found for this set of data. The means, standard deviations, and correlations among all of the variables are given in Table 1. To answer the first research question (To what degree is a students’ academic success predicted by their socio economic status, age, and academic ability/aptitude?) we found that the entire set of variables (socio economic status, age, high school grade point average, and ACT BLOCK ENTRY MLR EXAMPLE II PAGE 3 composite score) accounted for approximately 67%, R2 = .67, F(4, 495) = 253.32, p < .001, of the total variance in students’ academic success. Based on the results from this sample of students, the set of four predictor variables appear to provide a significant degree of influence on students’ academic success. To investigate the second research question (To what degree does a students’ academic ability/aptitude significantly predict their academic success over and above their socio economic status and age?), the first set of independent variables (socio economic status and age) were entered into the analysis as the first block and served as the control variables – then the second set of independent variables (high school grade point average and ACT composite score) were entered into the analysis as the second block to investigate any significant influence over and above the control variables. The set of ability/aptitude measures did predict significantly over and above the control variables, R2 = .65, F Change(2, 495) = 489.34, p < .001. Based on the results from this sample of students, the two measures of students’ ability/aptitude appear to offer significant additional predictive power beyond that contributed by the students’ socio economic status and age. The set of control variables accounted for approximately 2%, R2 = .02, F(2, 497) = 5.84, p < .01, of the total variance in students’ academic success. Of the two sets of variables used in this study, three of the predictor variables were significant (important) contributors to the explanation of the students’ academic success (see Table 2). In order of importance, the students’ high school grade point average ( = .78, p < .001) had the strongest influence. This was followed by the students’ ACT composite score ( = .11, p < .01) then the students’ age ( = -.10, p < .001). As can be seen, the ability/aptitude measures were both positive, indicating that the greater the students’ high school grade point average and ACT composite score – the greater BLOCK ENTRY MLR EXAMPLE II PAGE 4 the students’ academic success (academic majors’ grade point average). The students’ age was inversely related, indicating that the younger the student – the greater their academic success. BLOCK ENTRY MLR EXAMPLE II PAGE 5 Table 1 Means, Standard Deviations, and Correlations for Regression of Academic Success (N = ______) 1 1. Academic Success 2. Socio Economic Status 3. Age 4. High School Grade Point Average 5. ACT Composite Score 2 3 4 5 –– –– –– –– –– Means Standard Deviations BLOCK ENTRY MLR EXAMPLE II PAGE 6 Table 2 Results of Regression of Academic Success on Personal and Ability/Aptitude Variables Independent Variables B t Model 1 Socio Economic Status Age Model 2 Socio Economic Status Age High School GPA ACT Composite Score Note. R2 = ______ for Model 1 (p ______); R2 = ______ for Model 2 (p ______); Total R2 = ______ (p ______). **p < .01, ***p < .001
