Supplemental Text PCCI and DCI We evaluated the biological
advertisement

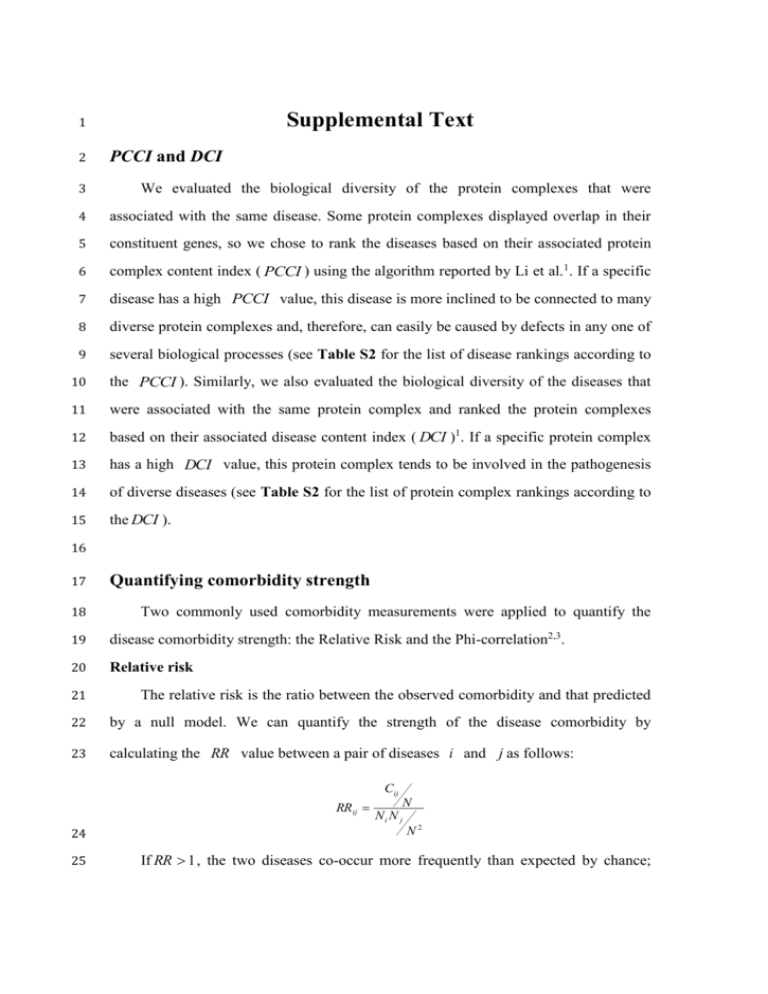
Supplemental Text 1 2 PCCI and DCI 3 We evaluated the biological diversity of the protein complexes that were 4 associated with the same disease. Some protein complexes displayed overlap in their 5 constituent genes, so we chose to rank the diseases based on their associated protein 6 complex content index ( PCCI ) using the algorithm reported by Li et al.1. If a specific 7 disease has a high PCCI value, this disease is more inclined to be connected to many 8 diverse protein complexes and, therefore, can easily be caused by defects in any one of 9 several biological processes (see Table S2 for the list of disease rankings according to 10 the PCCI ). Similarly, we also evaluated the biological diversity of the diseases that 11 were associated with the same protein complex and ranked the protein complexes 12 based on their associated disease content index ( DCI )1. If a specific protein complex 13 has a high DCI value, this protein complex tends to be involved in the pathogenesis 14 of diverse diseases (see Table S2 for the list of protein complex rankings according to 15 the DCI ). 16 17 18 Quantifying comorbidity strength Two commonly used comorbidity measurements were applied to quantify the 19 disease comorbidity strength: the Relative Risk and the Phi-correlation2,3. 20 Relative risk 21 The relative risk is the ratio between the observed comorbidity and that predicted 22 by a null model. We can quantify the strength of the disease comorbidity by 23 calculating the RR value between a pair of diseases i and j as follows: Cij 24 N Ni N j N2 25 If RR 1 , the two diseases co-occur more frequently than expected by chance; RRij 1 if RR 1 , the comorbidity between the two diseases is less than expected by chance. 2 Phi-correlation 3 Comorbidity can also be measured by calculating the Phi-correlation 4 ( -correlation) between two diseases. The Phi-correlation is the Pearson’s correlation 5 for binary variables. We can quantify the strength of the disease comorbidity by 6 calculating the correlation coefficient between a pair of diseases i and j as follows: ij 7 Cij N N i N j N i N j N N i N N j , 8 Where N is the total number of patients in the population, N i is the number of 9 patients that have been diagnosed with disease i and Cij is the number of patients 10 diagnosed with both diseases i and j . If 0 , the two diseases co-occur more 11 frequently than expected by chance; if 0 , the comorbidity between the two diseases 12 is less than that expected by chance. 13 These two comorbidity measures, RR and the Phi correlatio n , are not 14 completely independent, as they both increase with the number of patients affected by 15 both diseases, but they each carry intrinsic biases that are complementary2,3. Thus, we 16 used both comorbidity measures to ensure the robustness of our results. 17 18 19 Supplemental Text Figure 1. Distribution of RR values and Phi correlatio n values. In this study, more than 95% of the RR values in the original data source were 1 less than 100 (as shown in Supplemental Text Figure 1A), and the mean value of 2 these RR values was 5.80. Less than 5% of the RR values were greater than 100, 3 and the mean value of these RR values was 15961.69. Moreover, the maximum RR 4 value was 6,519,509. In addition, we also observed that more than 95% of the 5 Phi correlatio n values in the original data source were less than 0.05 (as shown in 6 Supplemental Text Figure 1B). To reduce the impact of these biased data, we filtered 7 the original comorbidity association data according to the data distribution. Here, we 8 selected the comorbidity associations with RR 100 and | Phi correlatio n | 0.05 for 9 further analysis. 10 11 One illustrative example of the hypothesis of our study 12 13 Supplemental Text Figure 2. An illustrative example of two diseases that are linked by a shared 14 protein complex. 15 Assuming that the protein complexes might be representative of the underlying 16 biology of the diseases, we used human protein complex data and genetic data of 17 human disease from reliable resources to construct human disease associations. First, a 18 disease was linked to a group of protein complexes if the protein subunits of these 1 protein complexes were known to be disease-related. Second, two diseases ( d1 and d 2 ) 2 were linked if at least one protein complex was associated with both d1 and d 2 in the 3 first step. For example, as shown in Supplemental Text Figure 2, mutations in the 4 MSH2 gene are known to cause Muir-Torre syndrome. And the MSH2 gene is a 5 subunit of several protein complexes (a group of protein complexes in blue box, such 6 as ERCC1-ERCC4-MSH2 complex, RAD52-ERCC4-ERCC1 complex and so on). So, 7 Muir-Torre syndrome is linked to these protein complexes in blue box through the 8 MSH2 gene. Similarly, mutations in the ERCC4 gene are known to result in 9 Xeroderma pigmentosum. And the ERCC4 gene is a subunit of several protein 10 complexes (a group of protein complexes in red box, such as ERCC1-ERCC4-MSH2 11 complex, MSH2/6-BLM-p53-RAD51 complex and so on). Hence, Xeroderma 12 pigmentosum is also considered to be associated with these protein complexes in the 13 red box through the ERCC4 gene. In these two groups of disease-related protein 14 complexes, ERCC1-ERCC4-MSH2 complex is shared by both diseases. Therefore, the 15 malfunction in the ERCC1-ERCC4-MSH2 complex can potentially lead to Muir-Torre 16 syndrome and Xeroderma pigmentosum, as well as increasing the risk of 17 co-occurrence of both diseases. Based on the observations above, Muir-Torre 18 syndrome and Xeroderma pigmentosumare considered to be linked through 19 ERCC1-ERCC4-MSH2 complex. 20 21 22 Comparison with previous studies based on shared genes or pathways 1 Supplemental Text Figure 3. Average disease comorbidity according to disease association strength 2 based on shared protein complexes, genes or pathways. 3 We compared the comorbidity tendencies of diseases linked by shared protein 4 complexes to those linked by shared genes and shared pathways. In general, as shown 5 in Supplemental Text Figure 3, the average comorbidity of disease pairs that share 6 protein complexes, or share genes, or share pathways is greater than that of disease 7 pairs that do not share. Likewise, it is reasonable to expect that disease pairs linked by 8 a greater number of disease-associated molecular signatures (i.e., protein complexes, or 9 genes, or pathways) would have higher comorbidity. As expected, Supplemental Text 10 Figure 3A clearly illustrates that the average comorbidity of disease pairs continues to 11 increase steadily with the strength of sharing protein complexes. In Supplemental Text 12 Figure 3B, it can be observed that the average comorbidity increasing speed based on 13 shared genes is faster than that based on shared protein complexes as shown in 14 Supplemental Text Figure 3A. However, when the number of shared genes is greater 15 than or equal to 2, the average comorbidity of the disease pairs has a tendency to 16 decline, which does not agree with the expected result. In Supplemental Text Figure 17 3C, the observed average comorbidity fluctuates and does not appear to have a clear 18 correlation with the number of shared pathways. The results observed are summarized 19 in Supplemental Text Table 1: 20 Supplemental Text Table 1. Pros and cons of the different methods Different Average comorbidity methods increasing rate RR Phi 0.278 0.410 Comorbidity change tendency RR Phi Average comorbidity keeps increasing from Average comorbidity keeps increasing from the 1st group to 4th group. the 1st group to 4th group. Average comorbidity increases from the 1st Average comorbidity increases from the 1st group to the 3rd group, but declines from the group to the 3rd group, but declines from the 3rd group to the 4th group. 3rd group to the 4th group. Protein complex-based method Gene-based 0.312 0.538 method Average comorbidity increases from the 1st Pathway-based Average comordibity tendency fluctuates 0.110 0.206 group to the 3rd group, but declines from the method from the 1st group to the 4th group. 3rd group to the 4th group. 1 *As shown in Supplemental Text Figure 3, the average comorbidity of disease pairs were divided into four groups according to the 2 strength of sharing disease-associated molecular signatures (i.e., protein complexes, or genes, or pathways). The average 3 increasing rate (AIR) was normalized using the formula: 3 AIR i 1 M gi 1 M gi , where M is the mean of the gi 3M g i i th group. 4 5 Supplemental Text Figure 4. A Venn-diagram of disease relationships obtained based on the different 6 methods. 7 As shown in Supplemental Text Figure 4, disease relationships captured by each 8 method have some degree of overlap with those of other methods. Each method can 9 disclose potentially novel disease relationships that are not captured through other 10 methods. In this study, the protein complex-based method captured 354 potential 11 candidates for novel disease relationships that are complementary to those obtained 12 using other methods. 13 14 Supplemental Text Reference 15 1 16 17 relationships. PLoS One 2009; 4: e4346. 2 18 19 Li Y, Agarwal P: A pathway-based view of human diseases and disease Park J, Lee DS, Christakis NA, Barabasi AL: The impact of cellular networks on disease comorbidity. Mol Syst Biol 2009; 5: 262. 3 Hidalgo CA, Blumm N, Barabasi AL, Christakis NA: A dynamic network 20 approach for the study of human phenotypes. PLoS Comput Biol 2009; 5: 21 e1000353.


