Review on concepts
advertisement
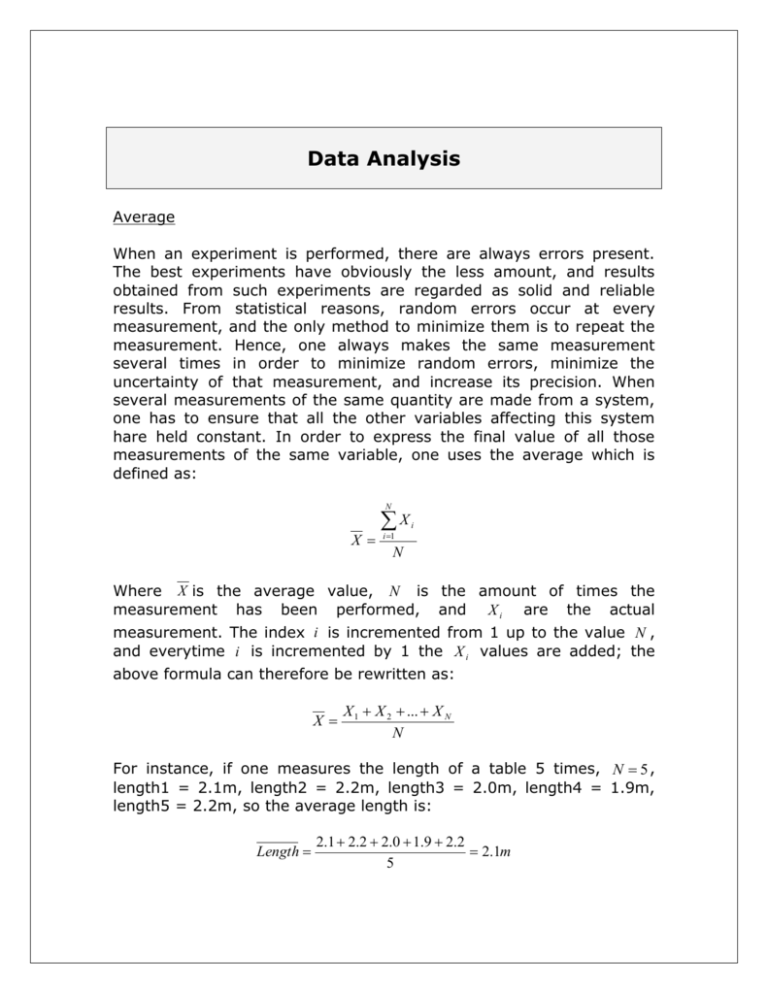
Data Analysis Average When an experiment is performed, there are always errors present. The best experiments have obviously the less amount, and results obtained from such experiments are regarded as solid and reliable results. From statistical reasons, random errors occur at every measurement, and the only method to minimize them is to repeat the measurement. Hence, one always makes the same measurement several times in order to minimize random errors, minimize the uncertainty of that measurement, and increase its precision. When several measurements of the same quantity are made from a system, one has to ensure that all the other variables affecting this system hare held constant. In order to express the final value of all those measurements of the same variable, one uses the average which is defined as: N X X i 1 i N Where X is the average value, N is the amount of times the measurement has been performed, and X i are the actual measurement. The index i is incremented from 1 up to the value N , and everytime i is incremented by 1 the X i values are added; the above formula can therefore be rewritten as: X X 1 X 2 ... X N N For instance, if one measures the length of a table 5 times, N 5 , length1 = 2.1m, length2 = 2.2m, length3 = 2.0m, length4 = 1.9m, length5 = 2.2m, so the average length is: Length 2.1 2.2 2.0 1.9 2.2 2.1m 5 Uncertainty In order to express the uncertainty of this measurement, one can perform another calculation usually noted X , whose formula is: X X N X 2 i 1 i N ( N 1) This quantity is also known as the standard deviation of the mean (SDM), or standard error. Hence, X is the uncertainty and SDM and expresses how much the average value X fluctuates. Both can be written together as: X X The bigger X is, the bigger the uncertainty on the value of X , the less precise X is, and the more random error are present. To calculate the SDM using the above length example, X would be: length 2.1 2.12 2.1 2.22 2.1 2.02 2.1 1.92 2.1 2.22 5(5 1) 0.06 Hence, the average length can be expressed as: 2.1 0.06m . So one is confident that the average length is within 2.04m and 2.16m . Obviously, the more trials made, the higher N becomes, and the lower X . So to minimize the uncertainty, the amount of random errors or to increase precision of a measurement, simply take more trials! ;) When computing X , make sure to keep one more significant figure for your X than for your X i values! In other words: do not round off your average value when using it in your X calculation! In order to evaluate the amount of random error, a similar calculation as percent error can be done. Let’s define it as RE. RE X *100% X Again, it is obvious that the smaller X , the lower RE is, and therefore, the less random errors are present. Please note that RE is just a number to estimate the amount of random errors, just as PE is a number used to estimate the amount of systematic errors. RE and PE are NOT the errors themselves! They are just indicators. One interpretation of random errors is the irreproducibility in making replicate measurement of the same quantity. In other words, it is impossible to make the exact same measurement of the same quantity over and over. Standard deviation The standard deviation is very similar to the standard error, but does not evaluate how much the mean spread; instead, the standard deviation (SD) is a measure of how spread the data points are. It is defined in two possible ways: X X N X 2 i i 1 N 1 Or X N X N 2 X i 1 N i 1 N 1 2 Percent Error The percent error is number expressed in percentage used to evaluate the amount of systematic errors in an experiment. When an experiment is performed and a measurement is obtained, one usually needs to evaluate how accurate this measurement is. Hence, the percent error is also used to estimate how accurate the result is. The bigger the percent error is, the less accurate the measurement, and the more systematic errors are present in the experiment. This calculation can only be done however if the accepted value of the result is known! If not, one has to compute the percent difference instead. The percent error (sometimes denoted as PE) is defined as: Percent error | E A| *100% A Where E is the experimental value (the value that has been measured and/or calculated in the experiment), A is the accepted value (what the measured value ought to be if there was no error) and || denote the absolute value. From the functional form of the percent error, it is clear that the closer A is to E, the lower PE is as the difference between A and E is taken. The absolute value is only there to allow fluctuations of E around A (A can be bigger or lower than E). Don’t forget to express your percent error as a percentage. The interpretation of systematic errors is the biases in measurement, which could be due to environmental, observational, calibration errors, etc… Those errors are called systematic as they will appear systematically in results with a constant effect (as long as all other factors are held constant). It is sometimes difficult to find the source of systematic errors, but one thing must be clear: calculation or human errors are not considered systematic errors. Percent Difference The percent difference is used when the accepted value of a measured or calculated quantity is not known, and one still would like to compare them with each other. Of course, this assume that several methods are used to obtained this quantity. Imagine that 2 different methods were used to obtain the variable X. The accepted value of X is not known, but if the two values of X are closed to each other, there is confidence that the methods used to obtained them are reliable. In this case, the percent difference is a small value. If the percent difference is a large value, one or more method have problems, but one is still unable from the percent difference to figure out which one. Percent difference Line equation The equation of a line is: | E 2 E1 | *100% E1 E 2 2 Y m* X b Where X is the independent variable, Y is the dependent variable, m is the slope and b is the Y-intercept. In the below example the slope is positive and equal to 2.5 while the y-intercept is equal to 1.3 This means that the line intercepts the Y axis at the point (0,1.3) and is going up. If the slope m was zero, it means that the variables X and Y are totally independent from each other; that is, one can choose any value for X, plug it into the equation and Y will always be the same value, and dictated by the value of b. If the line goes down, the slope m is negative. Line Equation Dependent Variable (units) y = 2.5x + 1.3 10 9 8 7 6 5 4 3 2 1 0 0 1 2 3 4 Independent Variable (units) Obtaining the slope / best fit line If you had to draw the best fit line (or regression line) by hand, the first thing to do is to figure out, if possible, the y-intercept. If one point is known at least, the accuracy of your line will be increased. The y-intercept is usually obtained by looking at the functional form of the given equation that models the experiment. In order to draw the bet fit line by hand, try to have roughly the same amount of points below and above your line in such way that the sum of the perpendicular distances from every point to the line is the same for the points below and above the line. Of course, the best fit line can never fit ALL the experiment points (due to errors that are always present in experiment). Therefore, when one computes the slope, two points must be chosen on the best fit line. Those points do not have to be the experimental data. It is a common mistake from students to use two of their experiment data to calculate the slope, disregarding entirely the best fit. The best fit line has to be found first, and based on it, the slope is computed using two points on that line (if the points on that line correspond to experimental data, it’s OK, but it would be a rare situation).
