Statistics Formulas Sheet - College Level
advertisement

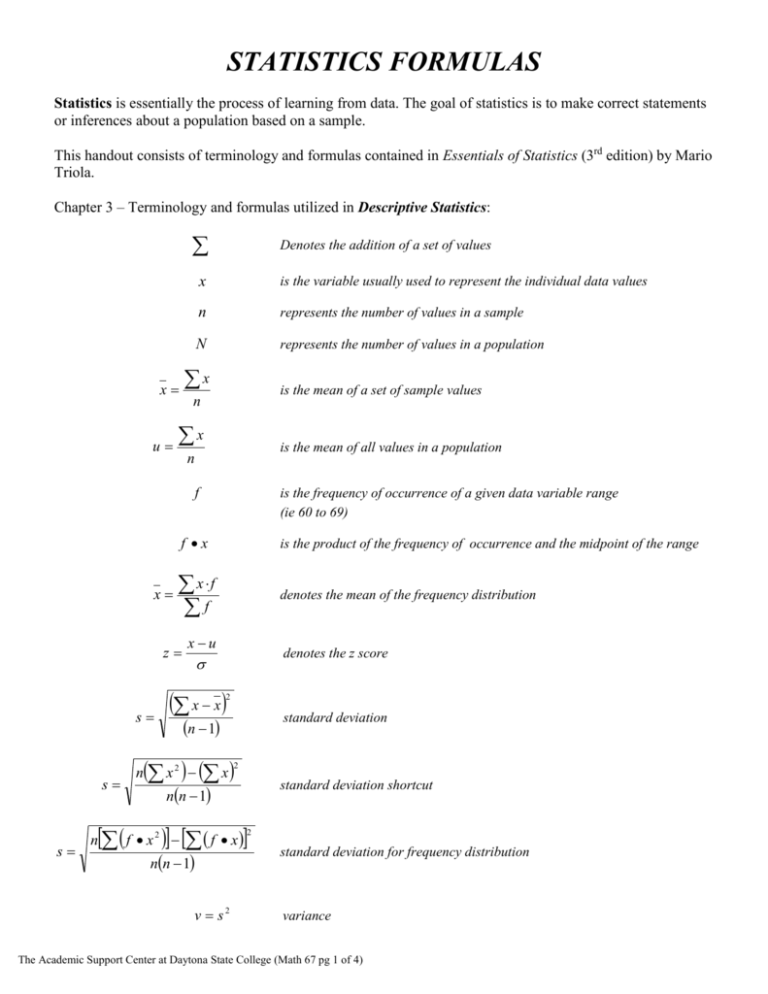
STATISTICS FORMULAS Statistics is essentially the process of learning from data. The goal of statistics is to make correct statements or inferences about a population based on a sample. This handout consists of terminology and formulas contained in Essentials of Statistics (3rd edition) by Mario Triola. Chapter 3 – Terminology and formulas utilized in Descriptive Statistics: x is the variable usually used to represent the individual data values n represents the number of values in a sample N represents the number of values in a population x x u Denotes the addition of a set of values is the mean of a set of sample values n x is the mean of all values in a population n f x is the frequency of occurrence of a given data variable range (ie 60 to 69) f x is the product of the frequency of occurrence and the midpoint of the range x f f denotes the mean of the frequency distribution z xu denotes the z score x x 2 s standard deviation n 1 n x 2 x 2 s s standard deviation shortcut nn 1 f x n f x2 2 nn 1 v s2 standard deviation for frequency distribution variance The Academic Support Center at Daytona State College (Math 67 pg 1 of 4) STATISTICS FORMULAS (continued) Chapter 4 – Terminology and formulas utilized in Probabilities: P denotes a probability denote specific events denotes the probability of event A occurring A, B, C P A P A number of times A occurred relative frequency approximation of probability number of times trial was repeated P A number of ways A can occur s number of different events n classic approach to probability P A or B P A PB if A, B are mutually exclusive P( A or B) P A PB P A and B if A, B are not mutually exclusive P( A and B) P A PB if A, B are independent P A and B P A PB A If A, B are dependent n! Permutations (no elements alike) n Pr n r ! n Pr n! Permutations ( n1 alike, …) n1!n 2 !...nk ! n Cr n! Combinations n r !r ! Chapter 5 – Terminology and formulas utilized in Probability Distributions: u x Px mean probability distribution x Px 2 Px u 2 standard deviation (probability distribution) n! p x q n x binomial probability n x ! x ! u n p mean binomial 2 n p q variance binomial n p q standard deviation binomial The Academic Support Center at Daytona State College (Math 67 pg 2 of 4) STATISTICS FORMULAS (continued) Chapter 6 – Terminology and formulas utilized in Normal Distribution: z xx xu standard score or s ux u x central limit theorem central limit theorem (standard error) n Chapter 7 – Terminology and formulas utilized in Sample Size Determination: ^ ^ ^ ^ p E p p E proportion where E z x E u x E mean where E z 2 n 1s 2 x2R 2 n 1s 2 x2L n 2 pq n if is known or E t s 2 variance Chapter 7 – Terminology and formulas utilized in Confidence Intervals: z n 0.25 z n pq 2 2 E2 2 2 ^ ^ proportion ( p and q are not known) ^ ^ E2 z 2 n E ^ ^ proportion ( p and q are known) 2 mean The Academic Support Center at Daytona State College (Math 67 pg 3 of 4) n if is unknown STATISTICS FORMULAS (continued) Chapter 8 – Terminology and formulas utilized in Test Statistics (one population): ^ z z p p pq n xu proportion – one population mean – one population ( known ) n t xu s n x2 n 1s 2 2 mean – one population ( unknown ) standard deviation or variance– one population The Academic Support Center at Daytona State College (Math 67 pg 4 of 4)


