Supplementary File The following details will provide the information
advertisement
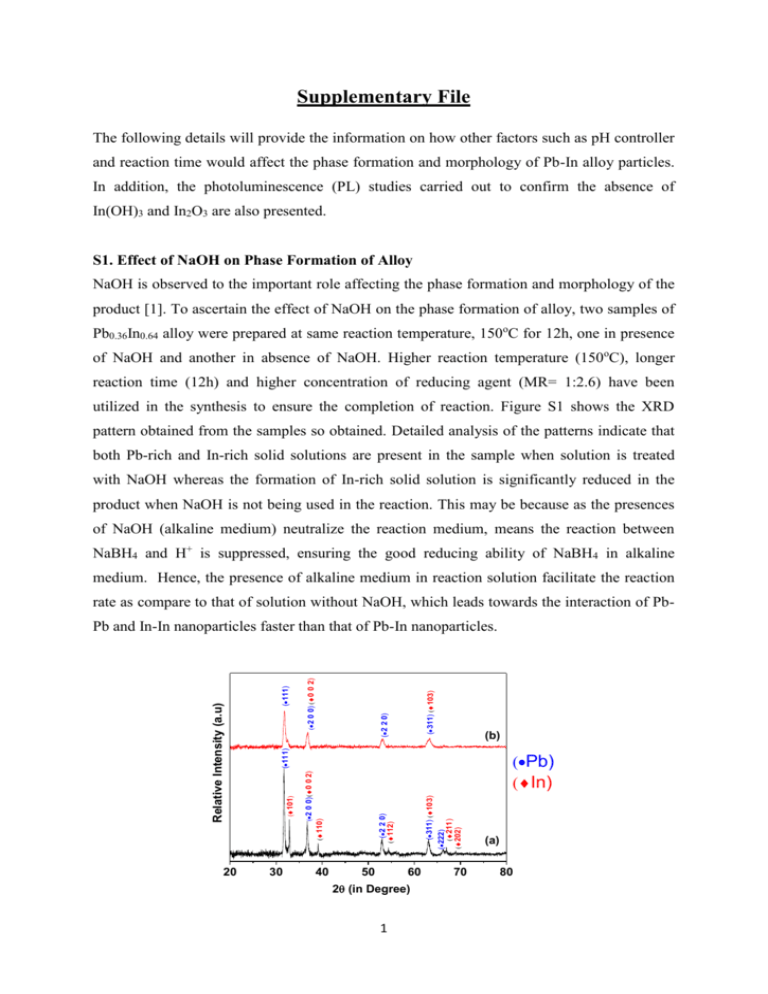
Supplementary File The following details will provide the information on how other factors such as pH controller and reaction time would affect the phase formation and morphology of Pb-In alloy particles. In addition, the photoluminescence (PL) studies carried out to confirm the absence of In(OH)3 and In2O3 are also presented. S1. Effect of NaOH on Phase Formation of Alloy NaOH is observed to the important role affecting the phase formation and morphology of the product [1]. To ascertain the effect of NaOH on the phase formation of alloy, two samples of Pb0.36In0.64 alloy were prepared at same reaction temperature, 150oC for 12h, one in presence of NaOH and another in absence of NaOH. Higher reaction temperature (150oC), longer reaction time (12h) and higher concentration of reducing agent (MR= 1:2.6) have been utilized in the synthesis to ensure the completion of reaction. Figure S1 shows the XRD pattern obtained from the samples so obtained. Detailed analysis of the patterns indicate that both Pb-rich and In-rich solid solutions are present in the sample when solution is treated with NaOH whereas the formation of In-rich solid solution is significantly reduced in the product when NaOH is not being used in the reaction. This may be because as the presences of NaOH (alkaline medium) neutralize the reaction medium, means the reaction between NaBH4 and H+ is suppressed, ensuring the good reducing ability of NaBH4 in alkaline medium. Hence, the presence of alkaline medium in reaction solution facilitate the reaction rate as compare to that of solution without NaOH, which leads towards the interaction of Pb- 20 (311) (103) (111) (2 0 0) (0 0 2) (2 2 0) (b) (111) 30 40 (311) (103) (2 2 0) (112) 50 60 2 (in Degree) 1 (222) (211) (202) (Pb) (In) (2 0 0) (0 0 2) (110) (101) Relative Intensity (a.u) Pb and In-In nanoparticles faster than that of Pb-In nanoparticles. 70 (a) 80 Figure S1. XRD pattern of Pb0.36In0.64 alloy, prepared at 150oC for 12h using MR of NaBH4 as 1:2.6 in different reaction medium (a) with NaOH and (b) without NaOH. S2. Effect of Capping Agent In order to investigate the effect of capping agent (PVP) on particle size and morphology, different samples of Pb0.36In0.64 alloys were prepared with different amount of capping agent (MR of precursor to capping agent = 1:0,1:5,1:10 and 1:20) while keeping the other reaction parameters same. The bright field TEM images of few salient samples are shown in Figure S2. It can be clearly observed that the particle size of (Pb) alloy is significantly reduced when capping agent is used as compared with the sample, prepared without capping agent. However, on further increase in the amount of the capping agent (MR > 1:10), we scarcely observe any change in the particle size. Hence, the appropriate MR of PVP used for controlling particle size is 1:10. (a) (b) Figure S2: Bright field TEM images of Pb0.36In0.64 prepared at 100oC for 4h using MR of NaBH4 as 1:1.5 with different MR of capping agent PVP (a) 1: 0 (no capping agent), (b) 1:10. S3. Effect of Reaction Time on Particle-Size of Alloy Particles As discussed, the reaction time plays a critical role in deciding the size of the nanoparticles. Figure S2 shows the bright field TEM images of the Pb0.36In0.64 alloy particles, prepared at 100oC for 4h using MR of NaBH4 as 1:1.5 with no capping agent, at different reaction time; 4h, 6h, 12h and 20h respectively. Longer reaction times, such as 20h or 12h, allow the particle to grow much larger than that at shorter reaction time (6h and 4h). Hence larger particle size is observed in the samples prepared with longer reaction times. The particle size can become as large as 1-2 um for longer time (12h or more). 2 (a) (b) 2 0 0 n m (c) (d) Figure S3: Bright field TEM images of Pb0.36In0.64 prepared at 100oC for 4h using MR of NaBH4 as 1:1.5 with no capping agent at different reaction time (a) 4h, (b) 6h, (c) 12h and (d) 20h. S4. Photoluminescence (PL) Studies for the Detection of In(OH)3 or In2O3 in the Samples. In order to investigate the presence of any by-products such as In(OH)3 or In2O3 in the samples, Photoluminescence (PL) studies of the solution samples, namely, pure In and Pb-In alloy samples, prepared with normal pressure chemical route without solvothermal, have been carried out and shown in figure S5 (a) and (b) respectively. Recently, it has been reported that In2O3 shows the PL spectra at wavelengths of 325, 330 and 338 nm, depending upon the particle size [2]. Apart from this, In(OH)3is also reported toexhibit PL spectra at 373 and 505 nm [3]. As shown in figure S3, no such peaks at these reported wavelengths corresponding to either In2O3 or In(OH)3 has been observed. Hence, the absorption bands observed in figure 6(b) are only from Pb-In alloy. 3 (a) (b) Figure S4. Photoluminescence (PL) spectra of solution samples of (a) pure In and (b) Pb-In alloy prepared with normal pressure chemical route. REFERENCES 1. Ni, Y.; Qiu, B.; Hong, J.; Zhang, L.; Wei, X. Hydrothermal synthesis, characterization, and influence factors of PbTenanocrystals. Materials Research Bulletin 2008, 43, 2668–2676. 2. Seo, W. S.; Jo, H. H.; Lee, K.; Park, J. T. Preparation and optical properties of highly crystalline, colloidal, and size controlled Indium oxide nanoparticles. Advanced Materials 2003, 15(10), 795-797. 3. Li, C.; Lian, S.; Liu, Y.; Liu, S.; Kang, Z. Preparation and photoluminescence study of mesoporous indium hydroxide nanorods. Materials Research Bulletin 2010, 45, 109–112. 4

