null estimated
advertisement
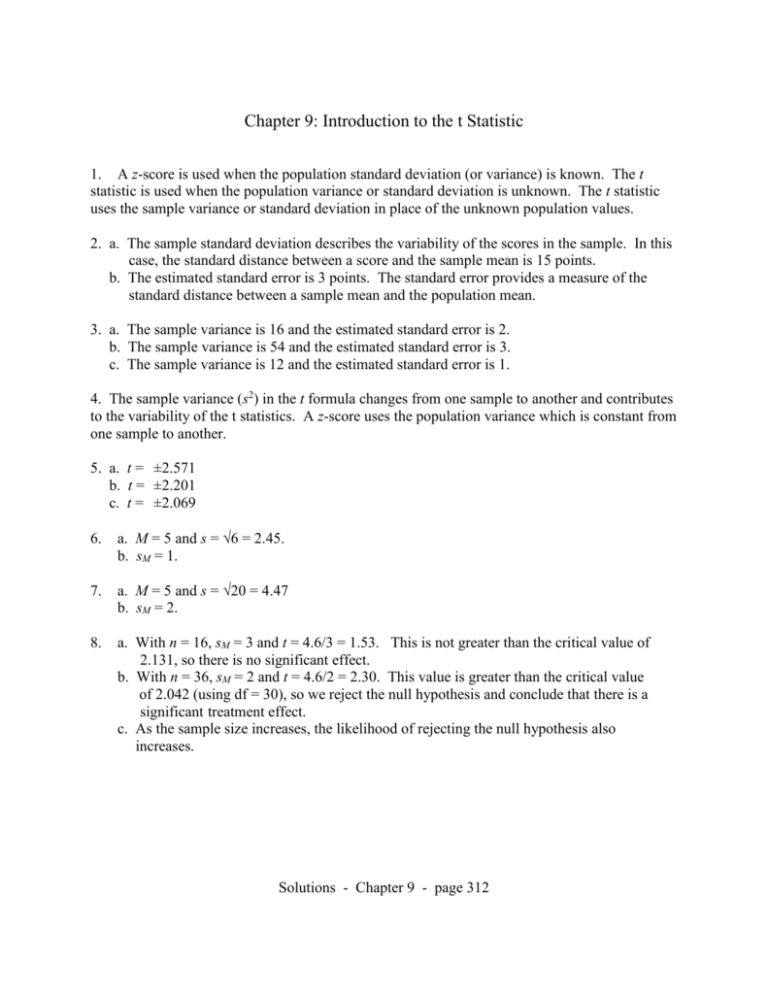
Chapter 9: Introduction to the t Statistic 1. A z-score is used when the population standard deviation (or variance) is known. The t statistic is used when the population variance or standard deviation is unknown. The t statistic uses the sample variance or standard deviation in place of the unknown population values. 2. a. The sample standard deviation describes the variability of the scores in the sample. In this case, the standard distance between a score and the sample mean is 15 points. b. The estimated standard error is 3 points. The standard error provides a measure of the standard distance between a sample mean and the population mean. 3. a. The sample variance is 16 and the estimated standard error is 2. b. The sample variance is 54 and the estimated standard error is 3. c. The sample variance is 12 and the estimated standard error is 1. 4. The sample variance (s2) in the t formula changes from one sample to another and contributes to the variability of the t statistics. A z-score uses the population variance which is constant from one sample to another. 5. a. t = ±2.571 b. t = ±2.201 c. t = ±2.069 6. a. M = 5 and s = 6 = 2.45. b. sM = 1. 7. a. M = 5 and s = √20 = 4.47 b. sM = 2. 8. a. With n = 16, sM = 3 and t = 4.6/3 = 1.53. This is not greater than the critical value of 2.131, so there is no significant effect. b. With n = 36, sM = 2 and t = 4.6/2 = 2.30. This value is greater than the critical value of 2.042 (using df = 30), so we reject the null hypothesis and conclude that there is a significant treatment effect. c. As the sample size increases, the likelihood of rejecting the null hypothesis also increases. Solutions - Chapter 9 - page 312 9. a. With s = 9, sM = 3 and t = –7/3 = –2.33. This is beyond the critical boundaries of ±2.306, so we reject the null hypothesis and conclude that there is a significant treatment effect. b. With s = 15, sM = 5 and t = –7/5 = –1.40. This value is not beyond the critical boundaries, so there is no significant effect. c. As the sample variability increases, the likelihood of rejecting the null hypothesis decreases. 10. a. 6 points b. The sample variance is 64 and the estimated standard error is sM = 2. c. For these data, t = 3.00. With df = 15 the critical value is t = ±2.131. Reject H0 and conclude that there is a significant effect. 11. a. With a two tailed test, the critical boundaries are ±2.306 and the obtained value of t = 3.3/1.5 = 2.20 is not sufficient to reject the null hypothesis. b. For the one-tailed test the critical value is 1.860, so we reject the null hypothesis and conclude that participants significantly overestimated the number who noticed. 12. a. With df = 8, the critical values are ±2.306. For these data, the sample variance is 36, the estimated standard error is 2, and t = 7/2 = 3.50. Reject the null hypothesis and conclude that the amount of time spent in the plain chamber is significantly different from chance. b. d = 7/6 = 1.17. c. With df = 8, the t values for 95% confidence are 2.306, and the interval extends from 2.388 to 11.612 seconds. 13. a. With df = 15, the critical values are ±2.947. For these data, the sample variance is 16, the estimated standard error is 1, and t = 78.2/1 = 8.20. Reject the null hypothesis and conclude that there has been a significant change in the level of anxiety. b. With df = 15, the t values for 90% confidence are 1.753, and the interval extends from 21.547 to 25.053. c. The data indicate a significant change in the level of anxiety, t(16) = 8.20, p < .01, 95% CI [21.547, 25.053]. 14. The null hypothesis states that the average age is not more than 20 years: H0: μ < 20 years. With df = 29, the one-tailed critical value is 2.462. For these data, the estimated standard error is 1.5, and t = 3.8/1.5 = 2.53. Reject the null hypothesis and conclude that the average age of the library books is significantly greater than 20 years. 15. a. With df = 63, the critical values are ±2.660 (using df = 60 in the table). For these data, the estimated standard error is 1.50, and t = 7/1.50= 4.67. Reject the null hypothesis and conclude that there has been a significant change in the average IQ score. b. Using df = 60, the t values for 80% confidence are 1.296, and the interval extends from 105.056 to 108.944. Solutions - Chapter 9 - page 313 16. The sample variance is 27, the estimated standard error is √3 = 1.73, and t = 6.3/1.73 = 3.64. For a two tailed test, the critical value is 2.306. Reject the null hypothesis, there is a significant preference for the terry cloth mother. 17. a. The estimated standard error is 1.50, and t = 7.7/1.50 = 5.13. For a one-tailed test, the critical value is 2.602. Reject the null hypothesis, children with a history of day care have significantly more behavioral problems. b. The percentage of variance accounted for is r2 = 26.32/41.32 = 0.637 or 63.7%. c. The results show that kindergarten children with a history of day care have significantly more behavioral problems than other kindergarten children, t(15) = 5.13, p < .01, r2 = 0.637. 18. a. The sample variance is 64, the estimated standard error is 1.60, and t = 6/1.60 = 3.75. For a two tailed test, the critical value is 2.797. Reject the null hypothesis and conclude that children with a history of day care have significantly different cognitive skills. b. Cohen’s d = 6/8 = 0.75 c. The results show that standardized math test scores are significantly different for children with a history of day care than for other children, t(24) = 3.75, p < .01, d = 0.75. 19. a. Cohen’s d = 3/6 = 0.50. With s = 6, the estimated standard error is 1.2 and t = 3/1.2 = 2.50. r2 = 6.25/30.25 = 0.207. b. Cohen’s d = 3/15 = 0.20. With s = 15, the estimated standard error is 3 and t = 3/3 = 1.00. r2 = 1.00/25.00 = 0.04. c. Measures of effect size tend to decrease as sample variance increases. 20. a. With n = 25 the estimated standard error is 4 and t = 8/4 = 2. r2 = 4/28 = 0.143. Cohen’s d = 8/20 = 0.40. b. With n = 16 the estimated standard error is 5 and t = 8/5 = 1.60. r2 = 2.56/17.56 = 0.146. Cohen’s d = 8/20 = 0.40. c. The sample size does not have any influence on Cohen’s d and has only a minor effect on r2 . 21. a. The estimated standard error is 0.20 and t = 2.2/0.2 = 11.00. The t value is well beyond the critical value of 2.492. Reject the null hypothesis. b. Cohen’s d = 2.2/1 = 2.20 and r2 = 121/145 = 0.8345 22. a. H0: µ ≤ 4 (not greater than neutral). The estimated standard error is 0.26 and t = 2.04. With a critical value of 1.753, reject H0 and conclude that the males with a great sense of humor were rated significantly higher than neutral. b. H0: µ ≥ 4 (not lower than neutral). The estimated standard error is 0.295 and t = –2.37. With a critical value of –1.753, reject H0 and conclude that the males with a no sense of humor were rated significantly lower than neutral. Solutions - Chapter 9 - page 314 23. a. H0: µ = 40. With df = 8 the critical values are t = ±2.306. For these data, M = 44, SS = 162, s2 = 20.25, the standard error is 1.50, and t = 2.67. Reject H0 and conclude that depression for the elderly is significantly different from depression for the general population. b. Cohen’s d = 4/4.5 = 0.889. c. The results indicate that depression scores for the elderly are significantly different from scores for the general population, t(8) = 2.67, p < .05, d = 0.889. Solutions - Chapter 9 - page 315
