Langmuir Probe Diagnostics
advertisement
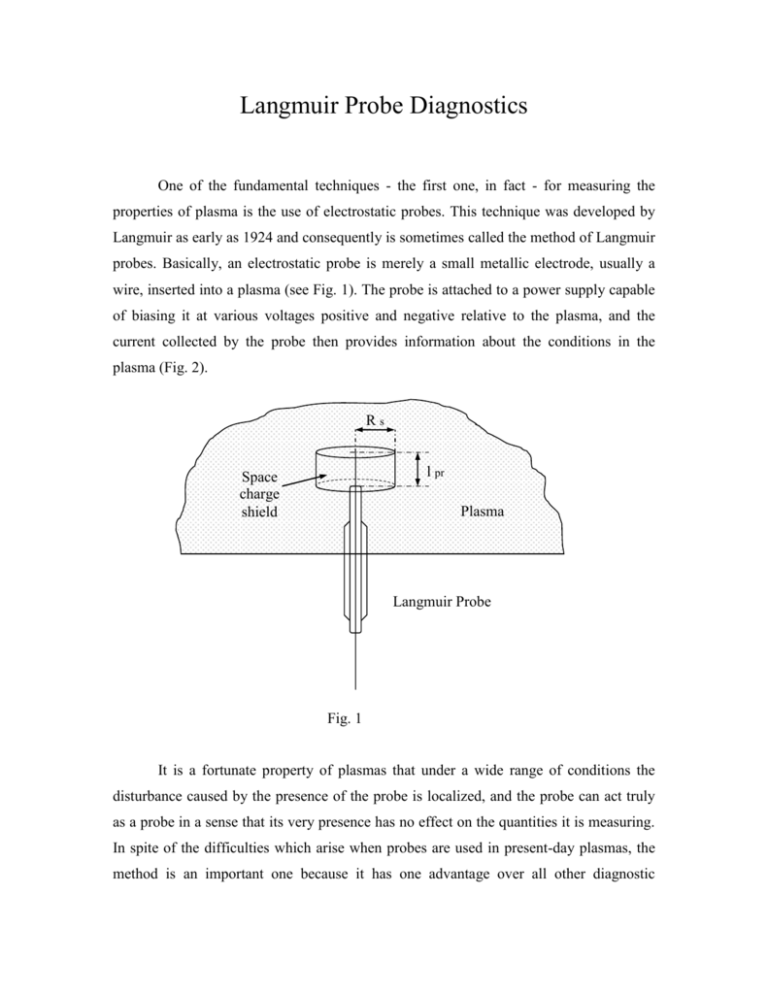
Langmuir Probe Diagnostics One of the fundamental techniques - the first one, in fact - for measuring the properties of plasma is the use of electrostatic probes. This technique was developed by Langmuir as early as 1924 and consequently is sometimes called the method of Langmuir probes. Basically, an electrostatic probe is merely a small metallic electrode, usually a wire, inserted into a plasma (see Fig. 1). The probe is attached to a power supply capable of biasing it at various voltages positive and negative relative to the plasma, and the current collected by the probe then provides information about the conditions in the plasma (Fig. 2). Rs l pr Space charge shield Plasma Langmuir Probe Fig. 1 It is a fortunate property of plasmas that under a wide range of conditions the disturbance caused by the presence of the probe is localized, and the probe can act truly as a probe in a sense that its very presence has no effect on the quantities it is measuring. In spite of the difficulties which arise when probes are used in present-day plasmas, the method is an important one because it has one advantage over all other diagnostic techniques: it can make local measurements. Almost all other techniques, such as spectroscopy or microwave propagation, give information averaged over a large volume of plasma. Plasma Probe V pr I pr Fig. 2 Experimentally, electrostatic probes are simple devices but the theory of probes is extremely complicated. The difficulty stems from the fact that probes are boundaries to a plasma, and near the boundary the equations governing the motion of the plasma change their character. In particular, the condition of quasineutrality is not valid near the boundary. The formation of shielding layer of space charge around the probe (with radius Rs, see Fig. 1 where cylindrical probe is considered) is a basis of the probe theory. The space charge shields the probe potential o [(r = Ro) = o, Ro is the probe radius]. The potential in the space charge shield decreases in respect to o up to the plasma potential pl. This is the potential non-perturbed by the probe. The surface with radius Rs, when (Rs) = pl is the boundary between space charge layer and the non-perturbed plasma. If the probe potential is positive in respect to pl the ions are repealed and the electrons are attracted by the probe. The space charge in the layer is negative. In the opposite case ( < pl ) the space charge is positive. The variation of the potential at conditions of a positive space charge is shown in Fig. 3. The thickness of the space charge shield depends on the probe potential o. Usually, the shield thickness is several Debay lengths Rs ~ (1 – 10 Rd). Rs r pl o Fig. 3 The main assumptions of the probe theory are the following: (i) Electron energy distribution in the non-perturbed plasma is Maxwellian; (ii) The probe radius Ro is greater than Debay length Rd and less than the mean free path of the electrons; (iii) The mean free path of ions and electrons is greater than Debay length. Therefore the collisions of electrons and ions in the space charge shield can be neglected; (iv) When < pl the electric field is retarding for the electrons, and the electron density is determined by Boltzmann ratio, i.e. eU N e N exp kTe U pl (1) In this case the probe current I is determined by the electrons and ions which can pass trought the shield and to reach the probe surface. In order to get an over-all view of the situation, let use look at the physical plote of probe current I versus probe voltage as shown in Fig. 4. Here negative, or electron, current to the probe is plotted against probe voltage with respect to an reference electrode. This plot can be obtained continuously in a steady-state discharge by changing the probe bias. The qualitative behaviour of this curve can be explained as follow. At large negative values of U (region AB ) almost all the electrons are repelled, and the ion sheath is formed. Ion saturation current is flowing to the probe. Further on, when the probe potential is changed, but it is still negative relative to pl, the electrons are still repealed and the ions are accelerated. At the point F, called floating potential, the probe is sufficiently negative to repel all electrons except a flux equal to the flux of ions, and therefore there is no net current. I E M I0 C F pl A U B Fig. 4 The electron current increases as U decreases in region CM which can be called retarding-field region of the probe characteristic. If the electron distribution is Maxwellian, the shape of the curve here, after the contribution of ions is subtracted, would be exponential. At this part the probe current is formed mainly by the electron current, i.e., I ~ Ie. The sheath radius decreases and the electrons reach the probe surface due to their thermal energy in case it is sufficient to overpass the retarding field (in this region < pl). Assuming Maxwellian electron energy distribution, the electron current to the probe can be presented as: eU I e I 0 exp kTe U pl (2) The electron saturation current Io corresponds to the point M of the probe characteristics (Fig.4). At this point the probe has the same potential as the plasma i.e., pl (this is commonly called the space potential). There are no electric filed at this point and correspondingly no space charge shield and the charged particles migrate to the probe because of their thermal velocities. Therefore I o je S Here, Vth 8kTe / me 1/ 2 1 eN eVth S 4 (3) is the thermal velocity of the electrons, S = 2Rolpr, the probe surface, and Io is the electron saturation current corresponds to point M [Fig. 4]. If the probe voltage is made positive relative to plasma, the electrons are accelerated towards the probe. Near the probe surface there is therefore an excess of negative charge, which builds up until the total charge is equal to the positive charge of the probe. This layer of charge, the sheath, is usually very thin, and outside of it there is very little electric field, so that the plasma is undisturbed. The electron current is that which enters the sheath through random thermal motions; and since the area of the sheath is relatively constant as the probe voltage is increases, there is fairly flat portion (region ME ) of the probe characteristics. This is called the region of electron saturation current. Probe characteristics processing Probe diagnostic techniques permit to determine the density of charged particles Ne, the electron temperature Te and the plasma potential pl. Usually the electronic part of the probe characteristic is used. It is convenient this part of the characteristics to be presented in semi-logarithmic scale as shown in Fig. 5. As far as the ion current has also contribution to the total probe current in this region, it must be subtracted from the measured full current. The contribution of the ion current can be determined by extrapolation of the ion current in the region AB (see Fig. 4). In the case of Maxwellian electron energy distribution, the probe characteristics is linear in semi-logarithmic plot as seen in Fig. 5. The point M corresponds to the probe potential equal to the plasma potential. There is characteristic “knee” at this point because the current dependence on the probe voltage changes. Determination of the electron temperature: The electron current in retarding region (CM) can be presented as: ln I e ln I 0 eU (4) kTe Therefore, the electron temperature Te can be determined from the slop of the probe characteristic. ln Ie E M ln I0 D C pl U Fig. 5 Determination of the electron density Ne The electron density is determined using the value of the probe current at the probe potential equal to the plasma potential, i.e. at point M, applying the ratio. Ne 4I o eVth S (5) Experimental task: Determine the electron density and temperature of the plasma using the electronic part of the single probe I-U characteristic measured in microwave discharge (see Fig. 6). Determine plasma potential. The contribution of ion current is subtracted from the total probe current. The probe radius and length are Rpr= 0.05 mm and lpr = 3 mm. Single Probe Characteristic 0.00674 0.00248 Electron current [ A] 9.11882E-4 3.35463E-4 1.2341E-4 4.53999E-5 1.67017E-5 6.14421E-6 -30 -20 -10 0 10 20 Probe-reference electrode voltage [U] Fig. 6 The file with data is I_V_char.dat. 30 40


