Bayesian Belief Network (BBN)
advertisement

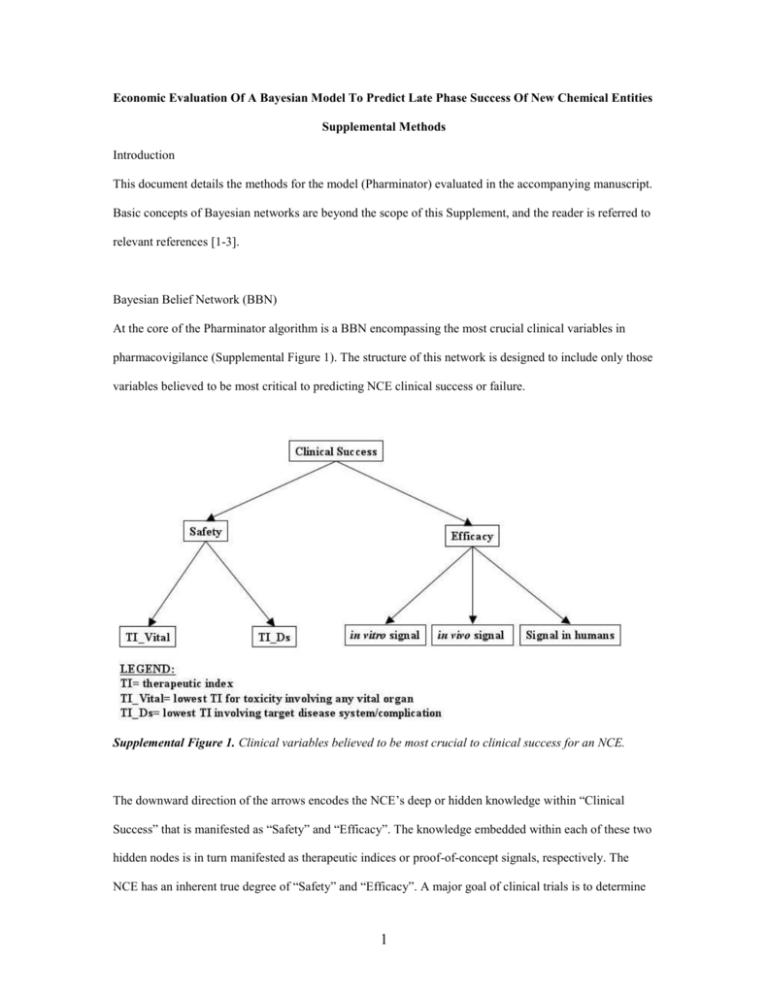
Economic Evaluation Of A Bayesian Model To Predict Late Phase Success Of New Chemical Entities Supplemental Methods Introduction This document details the methods for the model (Pharminator) evaluated in the accompanying manuscript. Basic concepts of Bayesian networks are beyond the scope of this Supplement, and the reader is referred to relevant references [1-3]. Bayesian Belief Network (BBN) At the core of the Pharminator algorithm is a BBN encompassing the most crucial clinical variables in pharmacovigilance (Supplemental Figure 1). The structure of this network is designed to include only those variables believed to be most critical to predicting NCE clinical success or failure. Supplemental Figure 1. Clinical variables believed to be most crucial to clinical success for an NCE. The downward direction of the arrows encodes the NCE’s deep or hidden knowledge within “Clinical Success” that is manifested as “Safety” and “Efficacy”. The knowledge embedded within each of these two hidden nodes is in turn manifested as therapeutic indices or proof-of-concept signals, respectively. The NCE has an inherent true degree of “Safety” and “Efficacy”. A major goal of clinical trials is to determine 1 what these true values are by studying samples and by assuming that the safety or efficacy in the studied samples are accurate estimates of the NCE’s true safety and efficacy. The same explanation can be used to justify the links going from Safety to the therapeutic index nodes, and from Efficacy to the signal nodes. It is this representation that allows Pharminator to predict the NCE’s inherent clinical success based upon the observed therapeutic indices and proof-of-concept signal data. Definitions Several terms require definition in order to understand the Pharminator algorithm: - Clinical Success: An NCE is clinically successful if it is still on the market 1 year after NDA approval. This is our preferred definition for “Clinical Success”. However, given our limited access to appropriate data, we revised this definition to include NCEs that either received New Drug Application (NDA) approval or were still active in Phase III of development. - Efficacy: An NCE is efficacious if it produces a “sufficient” degree of change in a surrogate or true marker, compared to control (placebo or current gold standard therapy). What constitutes a “sufficient” degree of change depends on (1) the clinical indication and (2) the development phase (during Phase II, the signal need not necessarily be statistically significant, while Phase III studies must show statistical significance). Certain indications may require only modest effect from an NCE in order to be successful (e.g. acute, relatively benign disorders), while others may require extreme effects (e.g. life-saving therapies). - Life-saving: An NCE is considered life-saving if 1. The disease for which it is indicated is fatal and, 2. There are no alternate life-extending therapies. The Pharminator model utilizes the life-saving status of the NCE to determine the influence that the Safety data will have on the calculation of the posterior probability of Clinical Success. - Markers- surrogate vs. true: A marker is an indicator of response to therapy. A surrogate marker is a marker that is not directly or primarily involved in the pathogenesis of the disease, 2 whereas a true marker is primarily integral to the disease mechanism. An example of a surrogate marker is the CD4 count in HIV. A true marker for HIV is viral load. - NCE source- acquired, self-origin: abroad, self-origin: USA : An acquired NCE is an NCE that a pharmaceutical company has licensed-in from another company, such as a biotechnology firm, or that has been acquired from some other source. A self-originated NCE is an NCE for which the initial pre-clinical development occurred within the same pharmaceutical company that will assume responsibility for conducting clinical trials. The prior probability of success differs significantly between acquired and self-originated NCEs [4]. NCEs that have undergone initial clinical testing abroad (and demonstrate potential effectiveness in humans) are more likely to succeed. - Prior bias: Pharminator gives the user the option of selecting whether the prior probability should be optimistic or pessimistic. The NCE’s intended therapeutic class affects the selection of the NCE’s prior probability of clinical success. The rationale for the “Prior bias” is detailed in the manuscript. - Safety: An NCE’s safety is essentially synonymous with toxicity. Every NCE that is not an inert placebo has some degree of “toxicity” in that even the desired effects of an NCE become toxic if a large enough dose is administered. An NCE’s safety is therefore defined as a degree of toxicity that is an acceptable balance against the benefit to the patient. - Therapeutic class: The therapeutic class of an NCE can be defined as the organ system affected by the disease process for which the NCE is indicated. This definition of therapeutic class is utilized rather than the more traditional chemical class or mode of action because prior probabilities of success are known for a total of 671 NCEs, stratified by therapeutic class [4], and stratifying by chemical class would fractionate the data beyond use with too many categories and too few NCEs in each category. The therapeutic classes included in Pharminator are: Analgesic/Anesthetic, Antimicrobial, Antineoplastic, Cardiovascular, Central Nervous System (CNS), Endocrine, Gastrointestinal (GI), Immunologic, Respiratory, and Miscellaneous. Clearly these are less specific categories than those used by clinicians (e.g. Calcium channel blockers, mono-amine oxidase inhibitors etc.) however as stated above, 3 there do not appear to be sufficient accessible data to allow for a more specific stratification without fractionating the data beyond utility. - Therapeutic index- vital organ, disease: The therapeutic index (TI) is the ratio of the NCE dose that produces an undesired effect to the NCE dose that produces the desired effect in a proportion of the study population. The numerator is the TD x (toxic dose in x% of the population) and the denominator is the ECy (effective dose in y% of the population). Each NCE has several therapeutic indices, depending on the number of specific adverse events (e.g. the TI for hepatotoxicity is different from the TI for nephrotoxicity), the number of specific desired effects (e.g. angiotensin converting enzyme inhibitors reduce blood pressure and reduce proteinuria), and depending on the definition of the proportion of the study population (i.e. the values of x and y). A larger TI represents a generally safer NCE. A smaller TI will be either too unsafe to be used clinically, or will require very close therapeutic drug monitoring in order to ensure safety (e.g. digoxin). The Pharminator model is designed to be inherently pessimistic, given the high rate of NCE failures to date, and the extreme costs associated with these failures. Therefore, the current implementation of Pharminator requires input for two specific TIs: the lowest TI for an undesired effect on any vital organ (brain, heart, lungs, liver, kidney, exocrine pancreas, bone marrow), and the lowest TI for an undesired effect on any organ or system that is already adversely affected by the disease/system for which the NCE is indicated. An example of the latter is retinal toxicity caused by an NCE indicated for the treatment of diabetes mellitus. Therapeutic class and NCE source are included in the model as “prior probability modifiers” and not as stochastic variables for two reasons: 1. Safety and Efficacy do not “cause” clinical success in the Pharminator model. The Safety and Efficacy nodes, and indeed all child nodes in the model, are in fact manifestations of the inherent degree of clinical success of the NCE. Contrary to this, therapeutic class and NCE source have a direct impact on NCE clinical success [4]. 4 2. While the NCE’s true safety, therapeutic indices, efficacy and proof-of-concept signals are not known, the NCE’s intended therapeutic class and source are known with certainty. It is therefore nonsensical to represent therapeutic class and NCE source as stochastic variables. We utilized the noisy-or assumption [5, 6] to calculate the prior probability of clinical success from the prior data on NCE failure rates stratified by therapeutic class and NCE source [4]. Prior Probability: Source & Selection TCSDD publications are the most extensive, accessible, and reliable publicly accessible source of the prior probability of NCE success and failure. DiMasi recently analyzed the causes of failure and reported the success rates for 671 NCEs for which INDs were filed between 1981 and 1992 [4]. In his report, he provides “current and maximum possible success rates” stratified by therapeutic class for 503 selforiginated NCEs. The “current success rate” is the fraction of the number of NCEs (in that class) that have been successful over all NCEs in that class. This is in fact a pessimistic prior because the implicit assumption is that all open NCEs (i.e. NCEs still in development) will fail. The “maximum possible success rate” is the success rate assuming that “all open NCEs will eventually be approved” – an optimistic assumption. DiMasi also provides probabilities of NCE success stratified by NCE source. Pharminator asks the user to indicate the NCE’s therapeutic class, NCE source, as well as the user’s desired “prior bias”, which may be either pessimistic or optimistic. The prior bias determines which therapeutic class prior probability is utilized: if the user selects “pessimistic” (the default setting), the current success rate is used to calculate the NCE’s prior probability of success. Conversely, if the user selects “optimistic”, the maximum possible success rate is used. Although DiMasi’s analysis is quite informative, he did not sub-stratify by therapeutic class and NCE source combinations. In order to allow Pharminator to choose a prior probability that most accurately reflects the NCE’s therapeutic class and its source, Pharminator utilizes the noisy-or assumption [5]. Paraphrasing Szolovits [6], the noisy-or assumption states that the probability that some set of variables causes an outcome equals the probability that at least one of the variables does so. The probability of 5 interest is P(Clinical Success | Therapeutic Class, NCE Source). Given the noisy-or assumption, the probability of interest can be calculated: 1 - P(Clinical Success | Therapeutic Class, Source) = (1 – P(Clinical Success | Therapeutic Class)) * (1 – P(Clinical Success | Source)) Therefore, P(Clinical Success | Therapeutic Class, Source) =1– [(1 – P(Clinical Success | Therapeutic Class)) * (1 – P(Clinical Success | Source))] ≈ the prior probability, P(Clinical Success) for the NCE in question and P(Clinical Failure) = 1- P(Clinical Success) Pharminator utilizes the prior bias selected by the user to determine which prior probability to utilize for the selected therapeutic class, then uses this probability along with the probability of success for the selected NCE source to calculate P(Clinical Success | Therapeutic Class, Source), given the noisy-or assumption. This calculated probability is utilized as the prior probability of Clinical Success for the NCE in question (Supplemental Figure 2). Supplemental Figure 2. Flowchart depicting how the prior probability of Clinical Success is determined. Conditional Probability Tables (CPTs) 6 The BBN requires CPTs for each node in order to be utilized for probabilistic inference. Although the data provided in the TCSDD reports is valuable, the format of those reports is not directly applicable to the construction of BBN conditional probability tables. In the absence of such data, the methods by which we constructed the CPTs are described here. DiMasi analyzed the causes of failure for 348 NCEs that were withdrawn from development [4]. It should be noted that NCEs that proceeded through all clinical trial phases but failed to achieve NDA approval are not included in DiMasi’s analysis. As well, DiMasi stratified the causes of failure by “primary” cause, thereby not disclosing any degree of overlap – i.e. NCEs that failed primarily due to one reason, but may have also failed for another reason (e.g. an NCE that failed because it was not safe, but was also not effective). His analysis demonstrated that of a total of 348 NCEs that were terminated, the primary reason for termination was efficacy in 121, safety in 72, economics in 109, and “other” in 46. Since Pharminator is concerned only with safety and efficacy, the probability that safety is the primary cause of failure is 72/(72 +121) = 0.37, and the probability that efficacy is the primary cause of failure is 121/(72 + 121) = 0.63. Assuming that the proportions of causes of failure are consistent across the withdrawn drugs, the CPT probabilities, P(Safety=F | Clinical Success = F) and P(Efficacy=F | Clinical Success = F), can be calculated by an “overlap function”, as follows: “Overlap Function”: P(Safety=F | Clinical Success = F) = total number of primary safety failures + (total number of primary safety failures * proportion of primary efficacy failures) = 72 + (72 * 121/193) = 0.606 P(Efficacy=F | Clinical Success = F) = total number of primary efficacy failures + (total number of primary efficacy failures * proportion of primary safety failures) = 121 + (121 * 72/193) = 0.860 These values (and their respective complement values) occupy the first rows of their respective CPTs. 7 While the overlap function permits estimation of the first row of each of the Safety and Efficacy CPTs (i.e. P(node = F | parent = F) and P(node = T | parent = F)), currently, there are no adequate, available data for the second rows of the Safety and Efficacy CPTs (P(node = F | parent = T) and P(node = T | parent = T)). For now, these values are currently set as pessimistic estimates. For the Efficacy CPT, the probability P(Efficacy = F | Clinical Success = T), i.e. the probability that an NCE is not efficacious given that it is clinically successful, is logically estimated to be very low. Until data for sensitivity analyses become available, this value is set at 0.05, and its complement, P(Efficacy = T | Clinical Success = T) is therefore 1 – 0.05 = 0.95. For the Safety CPT, the probability P(Safety = F | Clinical Success = T), i.e. the probability that an NCE is not safe given that it is clinically successful is also estimated to be even lower. Until data for sensitivity analyses become available, this value is set at 0.01 for NCEs that are not life saving, and for NCEs that are life saving, this value is set at 0.5. This difference is to reduce the influence that TIs have on the posterior probability of clinical success for life-saving NCEs. Just as for the hidden nodes, Safety and Efficacy, there are no easily accessible data on therapeutic indices and proof of concept signal data for NCEs that have failed. Devising models that approximate these relationships is a somewhat less arduous task than for Safety and Efficacy. With respect to the relationship between TI and Safety, it is assumed that TI is directly proportional to the degree of safety because a larger TI simply means more prescribing “room” between the effective dose and the toxic dose. We approximated the relationship between TI and safety by a logistic sigmoid model given that TI is a ratio and that the lowest rational value for a TI is 1, (Supplemental Figure 3): Logistic Sigmoid Function: The slope and intercept of this model were selected to reflect what is believed to be an accurate approximation of the relationship between TI and P(TI | Safety). Access to proprietary data would allow formal calculation of the slope and intercept values that would be specific to the company in question. 8 Supplemental Figure 3. Graphs showing the logistic sigmoid functions that are used to approximate the P(TI | Safety) CPT values from the TI values. A similar assumption is made for the proof-of-concept signal data in that the quantity of the signal is proportional to the degree of efficacy. In contrast to the sigmoid relationship between TI and safety, the relationship between proof-of-concept signal and efficacy is assumed to be a simple linear function (y = mx + b). However, the signal data must first be transformed to a standardized measure so that different ranges and scales will not influence the interpretation of the signal. For this purpose a modified signal-to-noise ratio is used, requiring the user to enter the mean and variance for the control and experimental groups, for each experimental environment (in vitro, in vivo – highest-order species, human), as well as whether each signal was measured by a true or surrogate marker. This formula provides a variance-corrected measure of the degree of signal as a value between 0 and 1. The resultant signal-to-noise ratio value is utilized by the linear models to estimate P(Signal | Efficacy) for in vitro, in vivo and human signals, stratified by true and surrogate markers. The slopes (and intercepts) of the linear models are adjusted to reflect differences between in vitro, in vivo and human signals, and between true and surrogate markers (Supplemental Figure 4). Specifically, the slope of the function is proportionate to: a) The environment order (in vitro < in vivo < human), and b) The marker (surrogate < true) Modified Signal: Noise Ratio 9 Supplemental Figure 4. Linear functions demonstrating how the modified signal: noise ratio value is utilized to approximate P(signal | Efficacy) for a series of randomly generated NCE & control means & variances. The algorithm for constructing the leaf node CPTs is summarized in Supplemental Figure 5. 10 Supplemental Figure 5. Overview of algorithm for constructing leaf node CPTs. The default state for all leaf nodes is “True”, and it is the leaf node CPTs that change in response to the TI and signal data entered by the user. This represents one major departure from BBN methodology: Pharminator’s use of the input data to determine the specific CPT to be used for a given set of fixed leaf node states. The acquisition of complete data on larger numbers of NCEs that have failed will facilitate the modification of the linear and sigmoid functions rather than direct changes to the leaf node CPTs. Justification for this approach is that this can actually work to the advantage of each drug development institution that utilizes Pharminator: Many pharmaceutical companies develop medications in a small number of therapeutic classes and therefore have NCE failure data that is highly specific to that pharmaceutical company’s future development projects. Therefore the use of these data to modify Pharminator’s CPT functions will result in a company-specific implementation of Pharminator, the predictive accuracy of which will be directly proportionate to the specific company’s development history and prior investments in NCE failures (i.e. accuracy proportionate to their losses). Smaller companies with little or no development history will not have the ability to implement a company-specific implementation, but will benefit from the prior knowledge of the entire industry, excluding confidential and privileged information from other companies. Data from a larger pharmaceutical company will remain exclusive to that specific pharmaceutical company unless that company agrees to allow Pharminator to utilize their data for the benefit of the entire industry, always maintaining confidentiality regarding specific NCEs that have failed. 11 Data Input and Output Pharminator requires the following input from the user: - NCE “demographics”: NCE name, therapeutic class, source, life-saving status - User’s prior bias preference (pessimistic vs. optimistic; default is pessimistic) - Signal data- for each of in vitro, in vivo (highest-order species) and human, the following data are entered for the maximal dose given, regardless of toxicity. Therefore, toxicity (safety) is not taken into account for signal data because Safety and Efficacy are assumed to be independent variables, conditional on the common parent, Clinical Success. The signal nodes’ inputs include: o NCE mean & variance o Control mean & variance o Type of marker: true or surrogate - Minimum TI_Vital as defined above - Minimum TI_Disease as defined above With this information, Pharminator selects the appropriate prior probability of clinical success, and calculates the posterior probability distribution for Clinical Success, Safety, and Efficacy. The hidden node “prior” probabilities are required in order to calculate hidden node posterior probabilities. These “prior” probabilities are calculated from the hidden and parent nodes’ CPTs: Calculating a Hidden Node’s “Prior” Probability: P(Hidden Node) = [P(Hidden Node | Parent Node) * P(Parent Node)] The prior and posterior probability distributions are displayed graphically as binomial distributions. The “n” for the Clinical Success prior probability distribution (“prior N”) is the total number of NCEs from which the prior data were attained. The “n” for the Clinical Success posterior probability distribution (post 12 N) is (prior N + 1). This is likewise for the prior N and post N for the Safety and Efficacy probability distributions. The complete algorithm is diagrammatically represented in Supplemental Figure 6. Supplemental Figure 6. Overview of the Pharminator algorithm. 1. Pearl J. Fusion, propagation, and structuring in belief networks. Artificial Intelligence 1986;29:241-88. 2. Pearl J. Probabilistic Reasoning in Intelligent Systems: Networks of Plausible Inference. San Mateo, CA: Morgan Kaufmann; 1988. 3. Schachter AD. Probabilistic Modeling of the Drug Development Domain: A Bayesian DomainKnowledge Application for Pharmacovigilance [Masters of Science]. Cambridge, MA: Massachusetts Institute of Technology; 2003. 4. DiMasi JA. Risks in new drug development: approval success rates for investigational drugs. Clin Pharmacol Ther 2001;69:297-307. 5. Pauker SG, Kassirer JP. Decision analysis. N Engl J Med 1987;316:250-8. 6. Szolovits P. Uncertainty and decisions in medical informatics. Methods Inf Med 1995;34:111-21. 13


![Quality assurance in diagnostic radiology [Article in German] Hodler](http://s3.studylib.net/store/data/005827956_1-c129ff60612d01b6464fc1bb8f2734f1-300x300.png)
