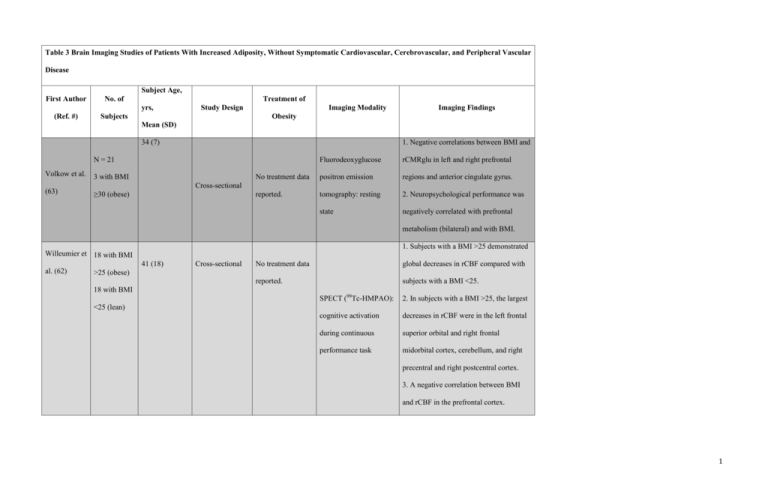
Table 5: Brain imaging studies of patients with increased adiposity
advertisement

Table 3 Brain Imaging Studies of Patients With Increased Adiposity, Without Symptomatic Cardiovascular, Cerebrovascular, and Peripheral Vascular Disease Subject Age, First Author No. of Treatment of yrs, (Ref. #) Study Design Subjects Imaging Modality Imaging Findings Obesity Mean (SD) 34 (7) 1. Negative correlations between BMI and N = 21 Volkow et al. (63) 3 with BMI Fluorodeoxyglucose rCMRglu in left and right prefrontal No treatment data positron emission regions and anterior cingulate gyrus. reported. tomography: resting 2. Neuropsychological performance was state negatively correlated with prefrontal Cross-sectional ≥30 (obese) metabolism (bilateral) and with BMI. 1. Subjects with a BMI >25 demonstrated Willeumier et 18 with BMI 41 (18) al. (62) Cross-sectional No treatment data global decreases in rCBF compared with reported. subjects with a BMI <25. >25 (obese) 18 with BMI SPECT (99Tc-HMPAO): 2. In subjects with a BMI >25, the largest cognitive activation decreases in rCBF were in the left frontal during continuous superior orbital and right frontal performance task midorbital cortex, cerebellum, and right <25 (lean) precentral and right postcentral cortex. 3. A negative correlation between BMI and rCBF in the prefrontal cortex. 1 1. A higher BMI, greater waist circumference, higher waist-to-hip ratio, Debette et al. N = 733 N = 67 (9) Cross-sectional No treatment data greater subcutaneous adipose tissue, and reported. (50) greater visceral adipose tissue were all 1. Structural MRI associated with smaller total cerebral 2. Radiography (CT)- brain volume. based measurements of 2. Waist-to-hip ratio, but not BMI, waist adipose tissue: circumference, subcutaneous adipose subcutaneous adipose tissue, or visceral adipose tissue, was tissue and visceral associated with increasing temporal horn adipose tissue ventricular volume. 3. None of the anthropometric or radiographic indexes of adiposity were associated with white matter hyperintensity volume. Marks et al. (58) N = 15 66.2 (5.8) Cross-sectional 7 active subjects: 1. Greater aerobic fitness (VO2 peak) was engaged in aerobic moderately associated with greater FA in activities >180 DTI MRI the left anterior and middle cingulum min/week for the VO2 peak during peak segments. previous 10 yrs exercise (VO2 peak = 2. A higher BMI and greater abdominal 8 sedentary aerobic fitness) girth were associated with lower FA in the subjects: engaged right posterior cingulum. Abdominal girth in any physical uniquely explained 53.9% of the total 2 activity <90 variance in FA in the age-sex-girth min/week for the regression model, whereas BMI uniquely previous 10 yrs explained 43.9% of the total variance found in FA in the age-sex-BMI regression model. Xu et al. (61) N = 51 With BMI ≥25, Cross-sectional 29 with BMI 32.1 (9.8) ≥25 With BMI <25, 22 with BMI 26.2 (9.1) <25 1. FA of the left and right body of the corpus callosum negatively correlated No treatment data with BMI. DTI MRI reported. 2. Mean diffusivity of the fornix and right and left splenium of the corpus callosum positively correlated with BMI. N = 95 Walther et al. (53) 1. A higher BMI was associated with 53 with BMI No treatment data Cross-sectional <25 (lean) With BMI <25, 22 with 71.0 (9.8) widespread smaller gray matter volumes Structural MRI reported in both anterior and posterior cortical regions. 3 25<BMI<30 With 2. When covarying for the effects of (overweight) 30<BMI≥25, hypertension, fewer significant areas of 20 with BMI 69.9 (8.1) negative correlation with BMI remained, ≥30 (obese) With BMI >30, including the left orbitofrontal gyrus, right 66.9 (9.9) inferior and precentral frontal cortex, right posterior cortex extending from the parahippocampal gyrus to the fusiform and lingual gyri, and right posterior and lateral cerebellar gray matter. 3. Increasing BMI was associated with larger white matter volumes including the frontal, temporal, parietal, and occipital lobes. 4. Executive functioning and memory performance positively correlated with gray matter volume in those regions significantly affected by BMI. N = 209 1. Obese subjects had smaller whole-brain 21 with BMI volumes than both lean and overweight Gunstad et al. ≥30 (obese) (51) With BMI ≥30, No treatment data Cross-sectional 63 with 45.11 (15.29) 25<BMI<30 (overweight) participants. Structural MRI reported. 2. Obese individuals had smaller total gray matter volume than both lean and With overweight participants. 4 117 with 25<BMI<30, 3. Trend toward smaller parietal and BMI <25 42.19 (16.46) temporal regional gray matter volumes in (lean) obese individuals. 4. Inverse correlations between BMI and With BMI <25, whole-brain volume and gray matter 33.00 (14.57) volume. 5. No differences across BMI groups in total white matter volume. N = 103 17 with BMI 1. FA values were lower in obese subjects With BMI >30, >30 (obese) compared with overweight and lean 51.89 (15.21) Stanek et al. 31 with (60) 25<BMI<30 No treatment data With Cross-sectional subjects in the fornix, genu, splenium, and DTI MRI reported. body of the corpus callosum. 25<BMI<30, (overweight) 2. No FA differences between lean and 45.88 (16) 55 with BMI overweight subjects. With BMI <25, <25 (lean) 42.64 (18.16) 24 with BMI With BMI ≥25, Pannacciulli ≥25 (obese) 32 (8) et al. (55) 36 with BMI With BMI <25, <25 (lean) 33 (9) Structural MRI: gray 1. Obese subjects demonstrated lower No treatment data matter and white matter gray matter density in the right reported. density was calculated as cerebellum, left post-central gyrus, right Cross-sectional the weighted average of frontal operculum, right and left putamen, 5 the gray matter and and right and left middle frontal gyri white matter voxels compared with lean subjects. located in the volume 2. Obese subjects demonstrated higher defined by the gray matter density in the left calcarine smoothing kernel. cortex, left middle occipital gyrus, left inferior frontal gyrus, and right cuneus of compared with lean subjects. 3. BMI was negatively associated with gray matter density of the left postcentral gyrus in obese but not lean subjects. 4. Obese subjects demonstrated greater white matter density in the vicinity of the striatum compared with lean subjects. N = 50 With BMI >25, 1. A higher BMI was associated with 5 with BMI 44.9 (7.2) lower NAA concentration in frontal gray >25 (obese) With matter. 15 with 25<BMI<30, 2. A higher BMI was associated with 25<BMI<30 44.0 (7.6) Gazdzinski et al. (56) No treatment data (overweight) With BMI <25, 30 with BMI 40.4 (9.3) <25 (lean) lower NAA concentrations in the frontal, 1 Cross-sectional reported. H-MRS parietal, and temporal white matter. 3. A higher BMI was associated with lower Cho concentration in frontal white matter. 6 1. A higher BMI was correlated with lower gray matter volumes in the orbital frontal cortex, hippocampus, and N = 94 With BMI ≤25, subcortical areas including the putamen, 77.5 (4) globus pallidus, and thalamus. With 2. A higher BMI was correlated with 29 with BMI ≤25 (lean) Raji et al. (52) 51 with No treatment data 30<BMI≥25, Cross-sectional 30<BMI ≥25 Structural MRI lower subcortical white matter volumes. reported. 77.2 (2.6) 3. The correlations between lower white (overweight) matter and gray matter volumes and 14 with BMI higher BMI remained significant after ≥30 (obese) With BMI>30 controlling for the effects of type 2 = 76.9 (2.8) diabetes mellitus. 1. There was a strong correlation between BMI and leptin level. 2. There was a significant negative Mueller et al. (59) No treatment data N = 49 Age, 26.4 (5) Cross-sectional DTI MRI correlation between FA and BMI in the reported. entire corpus callosum in women only. 3. There was a negative correlation between axial diffusivity and BMI in all 7 regions of the corpus callosum for both women and men. 1. A higher BMI was associated with decreased normalized brain volume. Ward et al. (49) No treatment data N = 114 54.2 (6.6) Cross-sectional Structural MRI Neither age, cholesterol, nor systolic reported. blood pressure mediated the effect of BMI on normalized brain volume. 1. Negative correlations observed between BMI and regional gray matter volume of bilateral medial aspects of the temporal N = 1,428 lobe, bilateral anterior lobes of the 27 with BMI cerebellum, bilateral fusiform gyrus, ≥30 (obese) bilateral frontal lobes, bilateral precuneus, Taki et al. (54) 273 with No treatment data 25<BMI<30 45.48 (15.07) Cross-sectional and midbrain in men only. Structural MRI reported. 2. Positive correlations observed between (overweight) BMI and regional gray matter volume of 1,128 with bilateral inferior frontal gyri, bilateral BMI <25 posterior lobe of the cerebellum, bilateral (lean) frontal and temporal lobes, bilateral thalami, and bilateral caudate heads in men only. 8 3. No correlations of any type observed between BMI and regional gray matter in women. Gazdzinski et N = 23 al. (57) With 1. Higher BMI was associated with lower 25<BMI<30, NAA/Cr, lower NAA/Cho, lower Glu/Cr, 68.9 (6.7) and lower Glu/Cho in the anterior 7 with 25<BMI<30 (overweight) No treatment data 1 With BMI <25, Cross-sectional 16 with BMI H MRS cingulate cortex. reported. 70.7 (6.5) 2. No relationships between BMI and <25 (lean) neurochemical levels were observed in the posterior cingulate cortex. Cho = choline; Cr = creatine; FA = fractional anisotropy; Glu = glucose; NAA = N-acetylaspartate; VO2 = oxygen consumption; other abbreviations as in Tables 2 and 3. 9


