S1-Chapter-1-Assignment1
advertisement

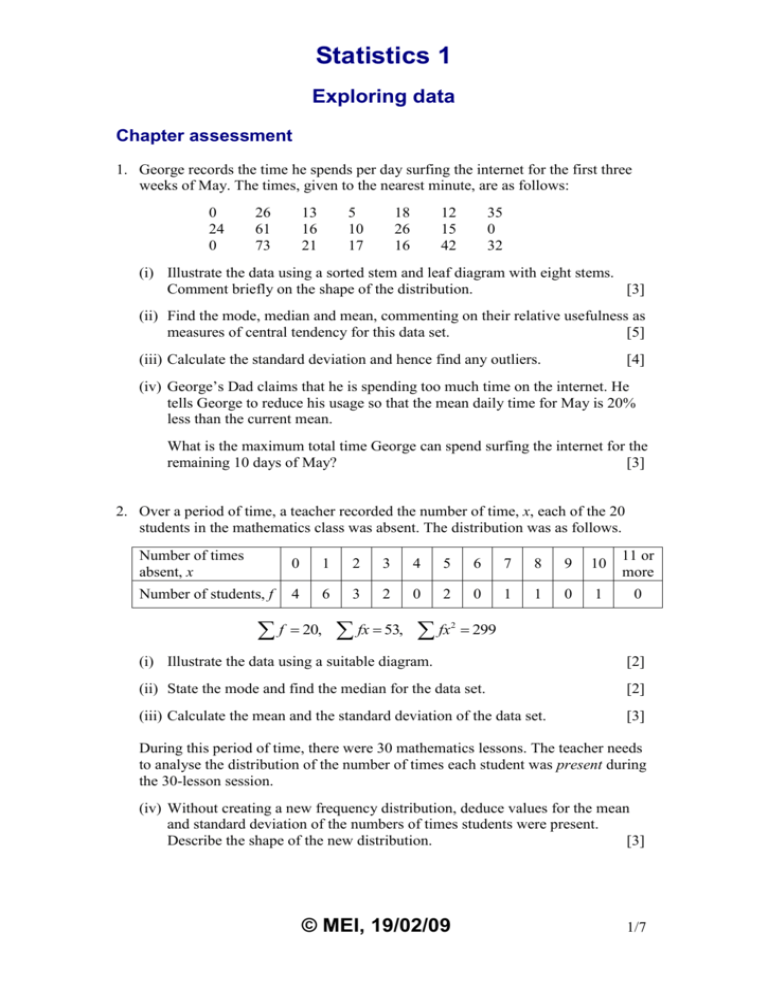
Statistics 1 Exploring data Chapter assessment 1. George records the time he spends per day surfing the internet for the first three weeks of May. The times, given to the nearest minute, are as follows: 0 24 0 26 61 73 13 16 21 5 10 17 18 26 16 12 15 42 35 0 32 (i) Illustrate the data using a sorted stem and leaf diagram with eight stems. Comment briefly on the shape of the distribution. [3] (ii) Find the mode, median and mean, commenting on their relative usefulness as measures of central tendency for this data set. [5] (iii) Calculate the standard deviation and hence find any outliers. [4] (iv) George’s Dad claims that he is spending too much time on the internet. He tells George to reduce his usage so that the mean daily time for May is 20% less than the current mean. What is the maximum total time George can spend surfing the internet for the remaining 10 days of May? [3] 2. Over a period of time, a teacher recorded the number of time, x, each of the 20 students in the mathematics class was absent. The distribution was as follows. Number of times absent, x 0 1 2 3 4 5 6 7 8 9 10 11 or more Number of students, f 4 6 3 2 0 2 0 1 1 0 1 0 f 20, fx 53, fx 2 299 (i) Illustrate the data using a suitable diagram. [2] (ii) State the mode and find the median for the data set. [2] (iii) Calculate the mean and the standard deviation of the data set. [3] During this period of time, there were 30 mathematics lessons. The teacher needs to analyse the distribution of the number of times each student was present during the 30-lesson session. (iv) Without creating a new frequency distribution, deduce values for the mean and standard deviation of the numbers of times students were present. Describe the shape of the new distribution. [3] © MEI, 19/02/09 1/7 Statistics 1 There are 12 boys and 8 girls in the class. The mean of the numbers of times boys were absent was 3, and the standard deviation was also 3. (v) Show that the mean of the numbers of times girls were absent is 2.125. [2] (vi) Find the standard deviation of the numbers of times girls were absent. [3] 3. A bookshop has a selection of 60 different mathematics books. The number of chapters contained in these books are summarised in the table. Number of chapters Number of books 3–5 6–8 9 – 11 12 – 16 17 – 21 22 – 30 4 6 12 14 14 10 (i) Calculate estimates of the mean and standard deviation of the number of chapters per book. [5] (ii) Why is it not possible to obtain exact values for the mean and standard deviation from the data in the table? [1] In fact, the exact values of the mean and standard deviation of the number of chapters per book are 14.7 and 6.1. Use these exact values for the remainder of the question. (iii) For each of the two statements below, state with reasons whether it is definitely true, definitely false or possibly true. Statement 1 Statement 2 There is at least one outlier below the mean. There is at least one outlier above the mean. [3] [3] The number of pages, p, in a book is modelled by p 20 x 15 where x is the number of chapters in the book. (iv) Calculate the mean and standard deviation of the number of pages, as given by this model. [3] 4. The first paragraph of the children’s book Stig of the Dump contains 107 words. The number of letters per word is summarised in the following table. Word length (x) 1 2 3 4 5 6 7 8 9 10 Frequency (f) 2 15 30 23 14 12 6 1 3 1 f 107, fx 443, fx 2 2183 . (i) Illustrate the distribution of word lengths by a suitable diagram. © MEI, 19/02/09 [2] 2/7 Statistics 1 (ii) State the mode, median and mid-range of the data. What feature of the distribution accounts for the different values of these quantities? [4] (iii) Calculate the mean and standard deviation of the data. Hence identify the outliers and discuss briefly whether or not they should be excluded from the sample. [6] A passage of an adult fiction book was analysed in a similar way. The mean number of letters per work was 5.07 and the standard deviation was 2.62. (iv) Compare the word lengths in the two passages of writing, commenting briefly on the differences. [3] Total 60 marks Exploring data Solutions to Chapter assessment 1. (i) 0 10 20 30 40 50 60 70 0 0 1 2 2 0 0 5 2 3 5 6 6 7 8 4 6 6 5 Key: 20 | 6 means 26 minutes 1 3 The distribution has a positive skew. (ii) Mode = 0 Median is 11th item = 17 Mean 462 22 21 The mode is not very useful as it is not representative of the data. Most of the values appear only once. The mean is skewed by two unusually large values. The median is the most representative of the data. © MEI, 19/02/09 3/7 Statistics 1 (iii) S xx x 2 nx 2 17220 21 22 2 7056 Standard deviation S xx n 1 7056 18.78 minutes (2 d.p.) 20 Outliers are more than 2 standard deviations from the mean i.e. greater than 22 2 18.78 59.57 or less than 22 2 18.78 15.57 The outliers are therefore 61 and 73. (iv) Target mean 0.8 22 17.6 Maximum total for the whole of May 17.6 31 545.6 Maximum total time available for the last 10 days of May 545.6 462 83.6 minutes 2. (i) frequency 6 5 4 3 2 1 0 1 2 3 4 5 6 7 8 9 10 Number of absences (ii) Mode = 1 Median is halfway between 10th and 11th values which are 1 and 2 Median = 1.5 (iii) Mean fx n 53 2.65 days 20 S xx fx 2 nx 2 299 20 2.65 2 158.55 S xx 158.55 2.89 days (3 s.f.) Standard deviation n 1 19 (iv) Number of times present = p, so p 30 x p 30 x 30 2.65 27.35 Standard deviation = 2.89 (3 s.f.) as before. The new distribution is negatively skewed. © MEI, 19/02/09 4/7 Statistics 1 (v) Total number of absences in class = 53 Total number of times boys were absent 3 12 36 Total number of times girls were absent 53 36 17 17 Mean number of times girls were absent 2.215 . 8 S xx 3 (vi) For boys: 11 S xx 99 99 fx 2 12 3 2 fx 299 fx 299 207 92 S xx fx nx 92 8 2.125 2 Total value of 2 For girls: 2 Standard deviation 3. (i) Number of chapters Mid-interval value x x² Number of books, f fx fx² Mean fx 2 207 fx n 2 2 55.875 S xx 55.875 2.83 days (3 s.f.) n 1 7 3–5 4 16 4 16 64 6–8 9–11 7 10 49 100 6 12 42 120 294 1200 12–16 14 196 14 196 2744 17–21 19 361 14 266 5054 22–30 26 676 10 260 6760 Total 60 900 16116 900 15 chapters 60 S xx fx 2 nx 2 16116 60 15 2 2616 S xx 2616 6.66 chapters (3 s.f.) Standard deviation n 1 59 (ii) The raw data is not available, so each piece of data in a particular interval is taken to be the mid-interval value. (iii) Outliers are more than two standard deviations from the mean, i.e. below 2.5 or above 26.9. Statement 1 is definitely false, since the lowest class interval is 3 – 5. Statement 2 is possibly true. There may be one or more data items in the 22 – 30 class interval which are above 26.9, but it is not possible to be certain, since all the items in this class could be less than 26.9. © MEI, 19/02/09 5/7 Statistics 1 (iv) p 20 x 15 p 20 x 15 p 20 x 15 20 14.7 15 309 s p 20s x 20 6.1 122 The mean number of pages is 309 and the standard deviation is 122. 4. (i) Frequency 30 25 20 15 10 5 1 2 3 4 5 6 7 8 9 10 Number of letters (ii) Mode = 3 Median is 54th word, which is 4 Midrange 1 10 5.5 2 The distribution is positively skewed, which is why the mode and median are smaller than the mid-range. (iii) Mean fx n 443 4.14 letters (3 s.f.) 107 S xx fx 2 nx 2 2183 107 4.142 348.897 348.897 S xx 1.81 letters (3 s.f.) Standard deviation n 1 106 Outliers are more than 2 standard deviations from the mean. In this case outliers are less than 0.5 or greater than 7.8, i.e, words of 8 letters or more. So the words of 8, 9 or 10 letters are outliers. These should not be excluded from the sample since they are valid items of data. There is no reason to exclude them. (iv)The adult fiction book has a greater mean word length and also a greater © MEI, 19/02/09 6/7 Statistics 1 standard deviation, so the adult fiction book has in general longer words and a wider variety of word lengths. It would be expected that an adult book would have a greater proportion of long words. © MEI, 19/02/09 7/7


