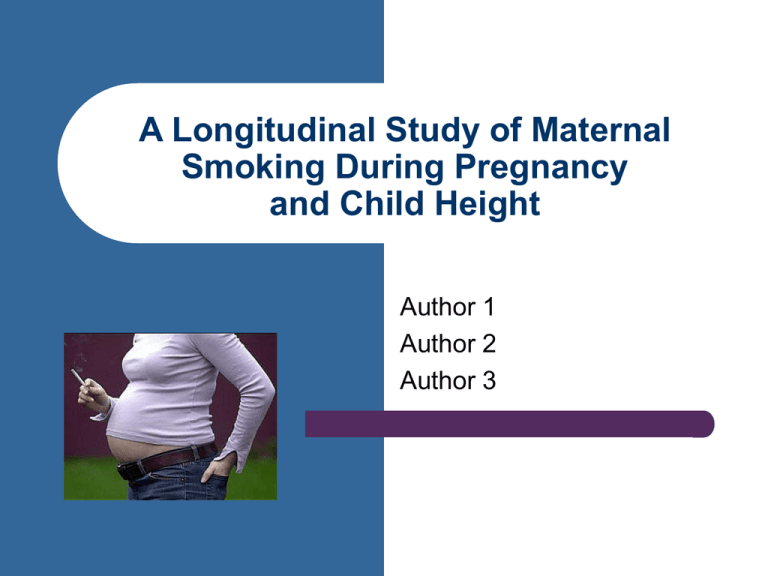
A Longitudinal Study of Maternal
Smoking During Pregnancy
and Child Height
Author 1
Author 2
Author 3
Our Study
What is the total effect of prenatal smoking on
child height from birth to adolescence?
Prospective cohort study
Longitudinal methods
Height deficits through adolescence may lead to
increased disease risk in later life.
evidence for maternal anti-smoking campaigns
Summary of Literature
Older cohort studies, some case-control
Few longitudinal methods
Stat. significance often not stated
Children at birth - age 5
Little to no height deficits after 1 year
No evidence of interaction with alcohol
Height measurements
Restricted to children with birth length
Recumbent height measured under age 2
Standing height measured over age 2
Most height measurements under age 2
In final analysis, only include children with height
measured at age 8 or older
Smoking Categorization
Excluded mothers who quit during pregnancy
Self-reported
Categories
–
–
–
–
Never smoked
1-9 cigs/day
10-19 cigs/day
20+ cigs/day
Confounders
Child age
Child sex
Child race
Child birth weight
Birth order
Gestational age
Paternal smoking during
pregnancy
Mother’s marital status during
pregnancy
Mother’s alcohol consumption
Mother’s total number of
prenatal visits
Maternal age during pregnancy
Maternal pre-pregnancy weight
Maternal height
Maternal education
Dataset restricted to:
Singleton births
No severe congenital abnormalities
Live births
First pregnancies only
Has maternal smoking variable
Mother did not quit smoking during pregnancy
Children age 9 and under
Birth length measured
Children with height measurements at or after age 8
See Figure 1
Characteristics of Smokers
17%
11%
54%
18%
Non smokers
1-9 cigs/day
10-19 cigs/day
20+ cigs/day
Smokers are more likely to be:
White
Less educated
Drinkers
Married to smokers
Thinner
See Table 1
Crude Plot of Height and Age by
Smoking Level
Mean height by age and maternal smoking during pregnancy
120
100
80
60
Mean Height (cm)
140
Cigarettes/day
0
2
4
Age (yrs)
Never smoked
10-19 cigs/day
6
1-9 cigs/day
20+ cigs/day
8
Mean Height by Age and Child Race
120
100
80
60
Mean Height (cm)
140
Mean height by age and by child race
0
2
4
Age (yrs)
White
Other
6
Black/African-American
8
Mean Height by Age and Birthweight
120
100
80
60
Mean Height (cm)
140
Mean height by age and by birth weight
0
2
4
Age (yrs)
Birth weight <=88 oz
6
Birth weight >88 oz
8
Statistical Model
Longitudinal data
–
–
Individuals’ repeat measurements are correlated
Ignoring correlation affects precision of parameter estimates
()
Generalized estimating equations (GEE)
–
–
–
Must specify link function, covariance structure, standard error
estimation
Covariance structure accounts for covariance due to repeated
measurements
Estimates of SE () are not affected by misspecification of the
correlation model
Our GEE model
Link function: Identity
–
Correlation structure: Independent
–
Since outcome variable is continuous
No correlation between repeat measurements
Standard error estimation: Robust
Missing data
Data was missing for many covariates
Assumed to be missing at random (MAR)
Weighting
–
–
–
Uses complete cases only
Up-weights children with covariate distributions
similar to people dropped due to missingness
Increases precision of SE estimates
Model Fitting:
Transformations of Age
Linear
Log-linear
Linear spline (knots between age 0.5 and 1.5)
Quadratic spline
Cubic spline
Compare using graphs and quasi-likelihood
criterion (QIC)
Model Fitting
100
100
0
50
50
Height (cm)
150
150
200
200
Crude
plot
of knot
height
age
1.5
age
at by
with
spline
Cubic
2
0
6
4
10
8
0
Age (years)
0
2 Height (cm) 4
Predicted 6height (cm)
Age (years)
8
10
Height 0 1 (age - 1.5) 2 (age - 1.5) 2 3 (age - 1.5) 3 4 X 4 k X k
Main Effects Output for Exposure
Weighted vs. Unweighted
SE
SE
(Weighted)
(Unweighted)
1-9 cigs/day
-0.152
0.17176
0.17173
-0.4883
0.1850
10-19 cigs/day
-0.590
0.23030
0.23029
-1.0415
-0.1388
20+ cigs/day
-0.163
0.20073
0.20071
-0.5564
0.2304
Weighted 95% CI
Covariates’ Effects on Height
Increase height
–
Decrease height
–
African American/Black, older maternal age, taller
mothers, and higher birthweight, male sex
Older gestational age and later birth order
No statistically significant effect
–
Maternal alcohol use, education, paternal smoking
during pregnancy, marital status, maternal prepregnancy BMI and # of maternal prenatal visits
See Regression Table
Interactions Explored
Alcohol
(2 = 3.54, df = 3, p = 0.3154 )
Paternal smoking during pregnancy
(2 = 0.89, df = 1, p = 0.3448)
Child age
(2 = 16.10, df = 12, p = 0.1866)
Interactions with Age
Height(cm)
(cm)
Height
145
125
Non-s m oker
105
1-9 cigs /day
10-19 cigs /day
85
20+ cigs /day
65
45
0
2
4
6
8
10
Age (years)
Test for interaction:
chi-square (df=12) = 16.10; p-value = 0.1866
Summary of Our Results
Interaction model confirms crude smoking
trend
Main effects model suggests dubious lack of
dose response relationship
Growth rate does not differ between smoking
levels
Strengths
Greater age range
Longitudinal methods
Less recall bias for sensitive subject
Limitations
Limited external generalizability
Potential selection bias due to restriction on primary
exposure
Correlation structure assumes no relationship between
repeat height measurements
Model for weights could be misspecified
Self-reported primary exposure
Mother reported paternal smoking
No control of time-dependent confounding
Unable to explore relationship through adolescence
Insufficient number observations for caffeine
Directed Acyclic Graph (DAG):
Total Effects
Directed Acyclic Graph (DAG):
Time Dependent Confounding
Future Steps
Explore unexpected trend across smoking
levels
Investigate direct effect of maternal smoking
during pregnancy on child height
–
–
Use more statistically advanced methods to control
for time-dependent confounding
Measure smoking and other covariates during
childhood
Examine older ages and effect of caffeine
Thank you!
Special thanks to Brenda Eskenazi, Houston
Gilbert, Alan Hubbard, Maureen Lahiff, David
Lein, and Eric Polley
Questions or comments?

