Comparative Genomics 2
advertisement

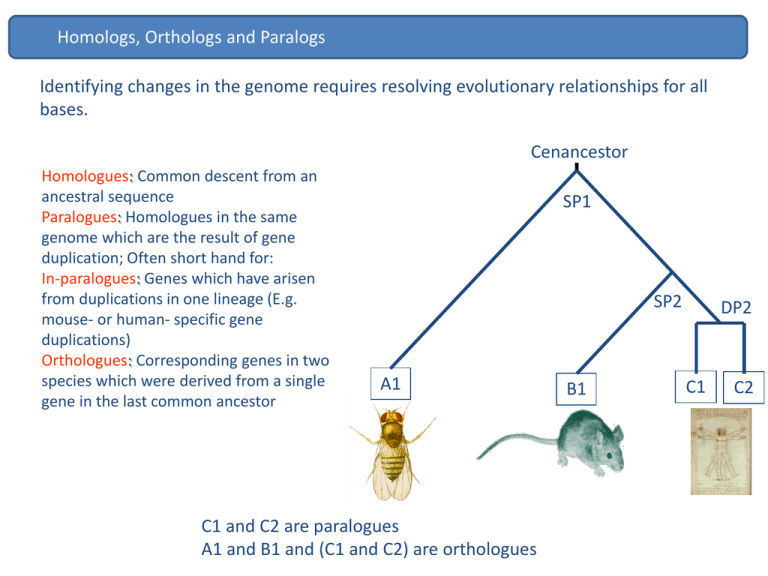
Homologs, Orthologs and Paralogs Identifying changes in the genome requires resolving evolutionary relationships for all bases. Cenancestor Homologues: Common descent from an ancestral sequence Paralogues: Homologues in the same genome which are the result of gene duplication; Often short hand for: In-paralogues: Genes which have arisen from duplications in one lineage (E.g. mouse- or human- specific gene duplications) Orthologues: Corresponding genes in two species which were derived from a single gene in the last common ancestor SP1 SP2 A1 C1 and C2 are paralogues A1 and B1 and (C1 and C2) are orthologues B1 DP2 C1 C2 Orthologs QuickTime™ and a decompressor are needed to see this picture. Orthologs 1:1 orthologues are most likely to retain the common ancestral function Human and mouse c-kit mutations show similar phenotypes. The utility of mouse as a biomedical model for human disease is enhanced when mutations in orthologous genes give similar phenotypes in both organisms. In a visually striking example of this, the same pattern of hypopigmentation is seen in (a) a patient with the piebald trait and (b) a mouse with dominant spotting, both resulting from heterozygous mutations of the c-kit proto-oncogene. Measuring evolutionary rates on protein coding genes There are 2 type of mutations: synonymous - don’t change the encode aa. non-synonymous-change aa. QuickTime™ and a decompressor are needed to see this picture. Measuring evolutionary rates on protein coding genes QuickTime™ and a decompressor are needed to see this picture. Measuring evolutionary rates on protein coding genes QuickTime™ and a decompressor are needed to see this picture. Measuring evolutionary rates on protein coding genes QuickTime™ and a decompressor are needed to see this picture. Measuring evolutionary rates on protein coding genes QuickTime™ and a decompressor are needed to see this picture. Measuring evolutionary rates on protein coding genes QuickTime™ and a decompressor are needed to see this picture. Measuring evolutionary rates on protein coding genes QuickTime™ and a decompressor are needed to see this picture. Measuring evolutionary rates on protein coding genes QuickTime™ and a decompressor are needed to see this picture. Measuring evolutionary rates on protein coding genes QuickTime™ and a decompressor are needed to see this picture. Measuring evolutionary rates on protein coding genes QuickTime™ and a decompressor are needed to see this picture. Measuring evolutionary rates on protein-coding genes dN/dS Conserving / purifying Neutral Diversifying / positive 1.0 0.0 << 1 = 1 >> 1 N.B: dN ds purifying selection neutral positive diversifying selection non-synonymous substitution rate synonymous rate Slow evolvers enzymes Non-enzymatic Fast evolvers QuickTime™ and a decompressor are needed to see this picture. QuickTime™ and a decompressor are needed to see this picture. Origin of new elements in the genome Gene duplication Proportion of (paralogous) genes in gene families Saccharomyces (yeast): 30% C. elegans: 48% Arabidopsis: 60% Drosophila: 40% Humans: 40% Evolutionary fate of gene duplicates 1. Duplication occurs but does not reach fixation in the population Chr. 3 Chr. 10 Chr. 10 Chr. 10 Chr. 10 Chr. 10 Chr. 10 Duplication of protein coding genes 2. Duplication occurs and fixes in the population but degenerates becoming a pseudogene: deletions, insertions and stop codons STOP STOP STOP STOP STOP Chr. 3 Chr. 10 Chr. 10 Chr. 10 STOP STOP STOP Chr. 10 Chr. 10 Chr. 10 Duplication of protein coding genes 3. Duplication occurs and fixes in the population – new gene is kept in the genome with function Chr. 3 Chr. 10 Chr. 10 Chr. 10 Chr. 10 Chr. 10 Chr. 10 ! Duplication of protein coding genes Evolutionary fate/role of new functional gene • Duplication for the sake of producing more of the same. Duplication of protein coding genes Duplication of protein coding genes Evolutionary fate/role of new functional gene • Duplication for the sake of producing more of the same. • Subfunctionalization Mitochondrial targeting sequence (MTS) evolution of GLUDs Subfunctionalization MTS positive selection accelerated evolution of GLUD2 MTS (P < 0.001) GLUD MTS Subfunctionalization Mitochondrial targeting capacity of GLUD MTSs MTS+GFP MitoTracker Merge MTS Human GLUD2 GLUD-GF P Mito Tracker Merge GLUD-GF P Mito Tracker Merge MTS GLUD2 Node B MTS GLUD2 Node A MTS Human GLUD1 Subfunctionalization GLUD2 sites under positive selection MTS alignment: Subfunctionalization Duplication of protein coding genes Evolutionary fate/role of new functional gene • Duplication for the sake of producing more of the same. • Subfunctionalization • Creation of a new gene function from a duplicate of an existing gene Duplication of protein coding genes Duplication of protein coding genes Gene Loss Gene loss is also associated with the origin of new traits. Loss of egg yolk genes in mammals Loss of olfactory receptors Brawand D. et al. (2006) Hayden S et al. (2010) How is this important ? QuickTime™ and a decompressor are needed to see this picture. Challenges ahead • • • • • How are the apparent differences in species “complexity” encoded? Are the ~19,000 genes in the genome the “important” bits? • How much genetic variation is determined epigenetically? • What is the function of the thousands of non-protein coding transcripts we find within the cell? Which genes are switched on in which tissues and at what developmental time-points? How much somatic variation is there? Currently, we can only explain <20% of the causes underlying many important diseases. How do we identify the cause of the rest?


