Near-surface Imaging at Meteor Crater, Arizona
advertisement
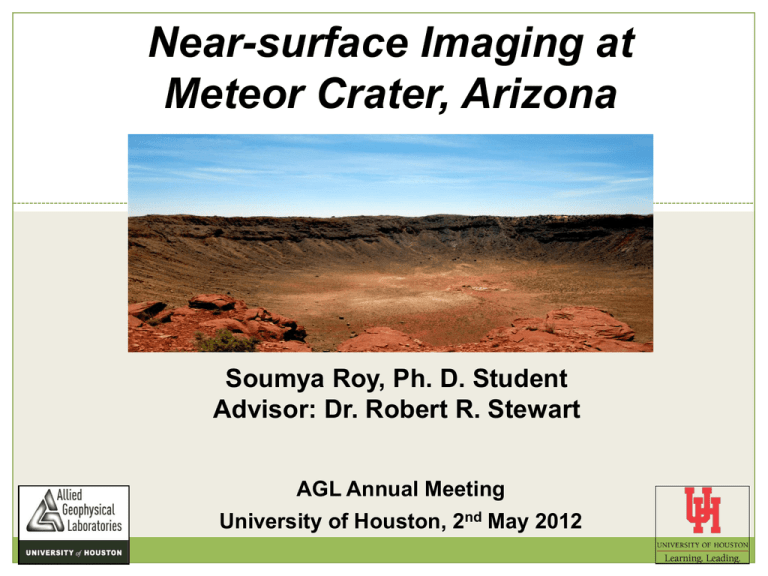
Near-surface Imaging at Meteor Crater, Arizona Soumya Roy, Ph. D. Student Advisor: Dr. Robert R. Stewart AGL Annual Meeting University of Houston, 2nd May 2012 Journey Through An Astrobleme Objectives N Meteor Crater, Arizona Geophysical surveys: - Ultrasonic, Seismic, Gravity and Magnetics, GPR Methodology: - Seismic refraction and reflection analysis - Ground-roll inversion Results and Interpretations Conclusions Daniel A. Russell (1999) (Animation showing particle movements for Ground-roll or Rayleigh-wave ) 2 Objectives To understand seismic wave propagation through brecciated materials To estimate the thickness of the ejecta blanket (a sheet of debris thrown out of the crater during the meteorite impact) To characterize the near-surface physical properties To develop general survey methodologies to image a highly complex near-surface To image near-surface reflectors and faults 3 Barringer (Meteor) Crater, Arizona 1 Ejecta curtain 4 2 (Shoemaker et al., 1974 and Kring, 2007) Ejecta blanket Excavated some 49,000 years ago Diameter of 1.2 km and a bowl-shaped depression ofSchultz, 180 Brown m University, NASA Ames Research Center - P. H. Startigraphy similar to Grand Canyon sequence 3 4 Seismic Surveys Seismic Line Source Receiver Type Type 10 lb (4.5 kg) Planted Sledgehammer vertical Hammer 88 lb (40 kg) AWD Accelerated Weight Drop Planted vertical Source Receiver Receiver Total receivers Sample spread length Record length (m) (s) (ms) interval interval interval (m) (m) 2 2 34 66 1000 0.25 3 3 216 645 3000 0.5 5 Ultrasonic Measurements Rock formation P-wave velocity (m/s) Moenkopi 1 815 ± 33 Moenkopi 2 1255 ± 106 Moenkopi 3 1570 ± 89 Why do velocities vary? 1) Samples are weathered differently 2) Samples are of irregular shapes and sizes 3) Measurement errors 6 P-wave Velocity from Seismic Refraction Analysis o First-break Pick analysis o Initial P-wave velocity model Raw shot from AWD line P-wave Velocity Structure o Iterative travel-time tomography through ray tracing o Minimizing the error between calculated and observed traveltimes 7 Result and Interpretation: P-wave Velocity Structure 8 S-wave Velocity from Ground-roll Inversion Raw shot from AWD line S-wave Velocity Structure Phase velocity (m/s) Dispersion Curve Frequency (Hz) Multichannel Analysis of Surface Waves (MASW) (Park et al., 1998, Park et al., 1999, Xia et al., 1999) 9 Result and Interpretation: S-wave Velocity Structure Ejecta blanket Moenkopi 10 Result: P-wave NMO Velocity Structure • Showing similar thinning pattern in low P-wave velocities (Turolski, 2012) 11 Interpretation: Near-surface Faults (Turolski, 2012) 12 Supporting Materials (Turolski, 2012) LiDAR (Light detection and ranging) for high-resolution topography data South-East Line (Roddy et al., 1975) Hammer Line 10-19.5 m 10-14 m South Line AWD Line (Roddy et al., 1975) - National Center for Airborne Laser Mapping (NCALM) 13.5-18 m 15-20 m 13 Interpretation: Ejecta Blanket Structure and Thickness 14 Conclusions • Ultrasonic measurements: P-wave velocities of 800-1600 m/s for Moenkopi hand specimens • Seismic refraction: P-wave velocities of 450-2500 m/s for a 55 m deep model • Ground-roll inversion: S-wave velocities from 200-1000 m/s for a 38 m deep model • A prominent change in velocities (low to high) is identified as the transition from ejecta blanket to bed-rock Moenkopi • Thinning of low-velocity ejecta blanket away from crater rim • Ejecta blanket thickness is estimated (15-20 m thick near the rim to only 5 m thick away from the rim) 15 Future Work and Proposals • 3D seismic surveys with densely spaced (1 m) receivers (3C) • Anisotropic studies of a complex near-surface • Using estimated S-wave velocities to calculate multi-component (anisotropic) statics • Developing a low-cost, stable method to estimate 2D rock properties (e.g. densities) • Elastic full-waveform inversion through ground-roll modeling 16 Acknowledgments • Dr. Robert R. Stewart • Dr. C. Liner • Dr. S. Hall Meteor Crater Field Crew (May, 2010) • Dr. D. A. Kring (Lunar and Planetary Institute) • Generous staff at the Meteor Crater Museum • Dr. K. Spikes and Ms. Jennifer Glidewell (The University of Texas at Austin) 17 Thank You What’s so optimistic about this? This guy must be a geophysicist !!! 18 19 Methodology: MASW • Multichannel Analysis of Surface Waves (MASW) - Generation of dispersion curves (phase velocity versus frequency plots) (Park et al., 1998; ibid 1999; Xia et al., 1999) x t x Phase f Amplitude spectra 20 MASW (Dispersion curves) x x t * f Phase spectra , ω = angular frequency and cω = phase velocity • Values are stacked over entire offset • The maximum value is obtained when - 21 MASW (Inversion algorithm) Observed Dispersion Curve CRayleigh = 0.92* VS Initial VS model Initial VS model Update VS model Observed Dispersion Curve NO Calculated Dispersion Curve Error minimized? YES - Modified after Xia et al., 1999 Final VS model 22

