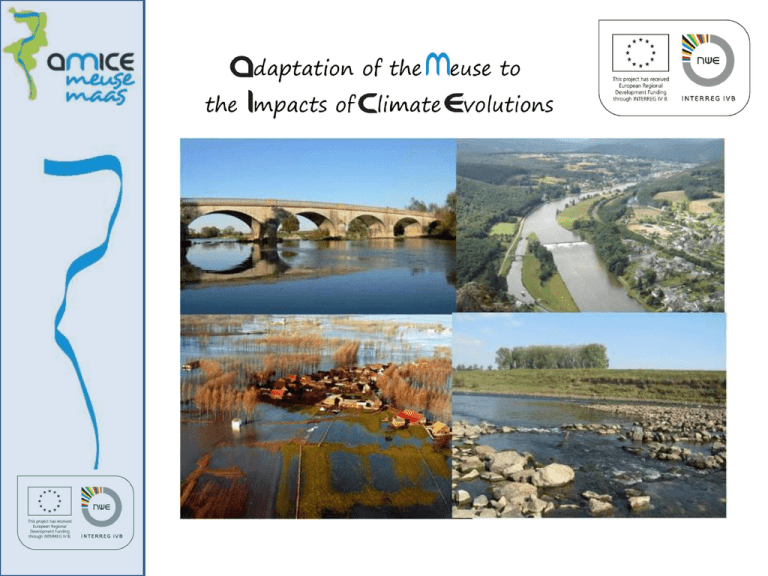
Action7 methodology - AMICE, Adaptation of the Meuse to the
advertisement

AP7 Quantification of the impacts of future floods and low-flows on the economy in the transnational Meuse basin Structure 1. Definition of the terms in economic losses 2. Evaluation Questionnaires 3. German perspective of assessment in flood losses 4. Drought losses a) Literature review b) PAWN (NL) c) EPIC Grid model (W) d) MIKE Basin 5. Open Questions 6. Discussion Type of damages - Direct flood losses: by inundation direct induced damages. direct flood losses postulate direct contact with water, e.g. buildings, inventory, traffic areas and agricultural areas direct flood losses are subdivided in immobile and mobile damages. - Indirect flood losses: indirect damages are not generated by direct contact with water. indirect damages are caused by detraction of economic activities. e.g. 1. Immediate asset value losses; a short term consequence of inundation of business e.g. loss of production, disruption of economic activities 2. Induced asset value losses; affected companies are suppliers of not affected companies (chain reaction) 3. Prosperity damages, a long term consequence in a flood affected area due to lost of confidence in safety, absence of tourism, reduction of investments in the affected area. Evaluation of direct flood losses • Qualitative/Quantitative? Qualitative Quantitativ Qualitative assessment of flood damage by damage risk maps A risk classification in e.g. negligible, low, medium, high vulnerability hazard Monetary assessment by damage functions corresponding to aggregated land use categories damage functions yield damage in proportion to water level h or partially, to the intensity of flow (e.g. velocity/ times/ depths of flow) The proportion of the damage is multiplied by an asset value Evaluation of direct flood losses • Methodology of Quantitative monetary assessment Land use category Asset value for land use category [€m2] Inundation area; -depht Relative damage Schadensfunktionen 100 rel. damage [%] 90 80 70 Schaden, % 60 50 40 30 20 10 0 0 1 2 3 4 5 6 Wasserstand, m Waterdepht [m] Stage damage function corresponding to land use Bachmann et. al. 2009 Damage per land use category [€] Evaluation of direct flood losses • Methodology of Qualitative assessment => damage risk map: Expressing the potential damage of vulnerable elements. Based on flood hazard and vulnerability Evaluation of direct flood losses Region Qualitative Quantitative Scale Micro Meso (local) (regional) Wallonia (ULG – GxABT) Wallonia (ULG - HACH) France (EPAMA) Flanders (FHR) Netherlands (RWS) Germany (IWW) Macro (global) X X X X X X X X X X X X Evaluation of direct flood losses Region Damage functions / Vulnerability indicators h vflow t vrise Wallonia (GxABT) - - - - Wallonia (HACH) X X X X France (EPAMA) X X - - Flanders (FHR) X - - - Netherlands (Deltares) X - - - Germany (IWW) X X - - Evaluation of direct flood losses Region Damage functions / Vulnerability indicators Wallonia (ULG – GxABT) The damage risk map (restricted access), expressing the potential damage of vulnerable elements located in areas subject to flood hazard by overflowing rivers. The risk of damage is determined by the combination of two factors: the flood hazard and vulnerability. The risk of damage may be negligible, low, medium or high. Wallonia (ULG - HACH) relative damage functions; loss model: FLEMO; damage ratio of the asset value; land registry income as an indicator for assessing the asset value; vulnerability based on combination of water depth, velocity, duration, water rising and social indicators recorded in the INS database France (EPAMA) The used damage functions yield damage in proportion to water level h or partially, to the flow velocity if v> 0.5m/s. A damage function is defined for each land use category . Flanders (FHR) relationship between a given water depth and the dependent damage factor for different land use category's Netherlands (RWS) Stage damage functions (SDFs) are used to calculate the proportion of the maximum damage which actually occurs under given flood depths. Germany (IWW) Based on indirect damage functions. The used damage functions yield damage in proportion to water level h or partially, to the intensity of flow (e.g. velocity/ times/ depths of flow). Land use data Region Available data Wallonia(GxABT) COSW Wallonia (HACH) PICC Database IGN Database INS Land registry database France (EPAMA) CORINE Land Cover IGN maps Non-digital Information Flanders (FHR) CORINE Land Cover Small Scale Land Use Map Flanders KADVEC Industrial Zones Top50vGIS Multinet Transmitting Water Collection Plants Water Surface Netherlands (RWS) CORINE CLUE Landuse Scanner Germany (IWW) CORINE data ATKIS data Land use categories Region Category groups (CORINE) Artificial Surfaces Wallonia (GxABT) Wallonia (HACH) Flanders (FHR) - housing - road - rail and waterways network - Roads and Railways - Point elements - Residential buildings - Urban area - Industrial buildings - Industrial area - Infrastructure - Airport Agricult ural Areas Forest and semi natural areas Wetlands Water bodies others X X - - - Communities facilities & public utilities - Economic activities - - - - - - Cropland - Pasture - Nature - Forests - Recreation - X Land use categories Region Category groups (CORINE) Artificial Surfaces Agricultural Areas Netherlands (RWS) - Residential – high density - Residential – low density - Commercial - Port areas - Infrastructure - Construction/ mines - arable land - pasture France (EPAMA) - town centre's - houses out of town - industrial or commercial areas - transport network Germany (IWW) - private housing/ household contents - industry/manufacturing sector - commerce/service sector - mixed use - state/public sector Forest and semi natural areas Wetlands Water bodies others - Recreation X - - - equipments - other X X - X - - - - - Cars, mobile transport assets - leisure Evaluation of indirect losses Region Qualitative Quantitative Scale Micro Meso Macro Wallonia (ULG - GXABT) - - - - - Wallonia (ULG - HACH) - - - - - - - - X X - X - X - - - - - - - X - X - France (EPAMA) Flanders (FHR) Netherlands (RWS) Germany (IWW) Indirect losses Region Categories / economic sectors Data basis Wallonia (GxABT) - - Wallonia (HACH) - - France (EPAMA) Vulnerability of: - crisis management and emergency services - services and activities required for recovery - activities potentially creating more damage (SEVESO, fuel, waste storage) - major networks (power stations, drinking water stations) Flanders (FHR) - Agriculture (pastures and croplands) - Industry - Houses Netherlands (RWS) Germany (IWW) -Trade, Commerce - Financial sector - Industry - Public and private service - SIRENE - PPRi - ICPE - Geomarketing Data (infas) Uncertainty Region Wallonia (GxABT) Direct flood losses Method Indirect Flood Losses - - - Flood frequency uncertainty Wallonia (HACH) X France (EPAMA) X Flanders (FHR) Evaluated by experts - Netherlands (RWS) X Germany (IWW) - - Inundation depth - probability of flooding - stage-damage functions (SDFs) - maximum damage per land use type - land use - Input variables X - German perspective • General Approach Land use category Asset value for land use category [€m-2] Inundation area; -depth Relative damage Schadensfunktionen 100 rel. damage [%] 90 80 70 Schaden, % 60 50 40 30 20 10 0 0 1 2 3 4 5 Wasserstand, m Waterdepht [m] Stage damage function corresponding to land use 6 Damage per land use category [€] German perspective • Damage Categories - Spatial Information : ATKIS Data (Vector data 1:25.000) - Aggregation of the ATKIS object groups to damage categories for meso-scale economic damage potential analysis - Allocation of damage functions and asset values to corresponding damage categories German perspective • Example: Damage Category Aggregation Objektart ATKIS Characterisation 5101 Stream, Rivulet 5102 chnnel 5112 Inland lake, artificial lake 2111 general residential building area 2121 Mining Company 2122 Disposal site 2129 Waste Water Treatment Plant 2112 Industry and Commerce Index Category (mobil) Index Category (immobil) Not relevant in damage assessment 0 0 Private housing 1 101 Industry and Commerce 2 102 Characterisation use category Land River, German perspective • Damage functions of categories 1. Large number of damage functions in literature 2. Representation of this variety by stochastic interpretation => Probability Density Function for each water level => Population Mean => damage function for economic assessment (Kutschera, 2008) German perspective • Damage function (industry immobile) - including uncertainty => Quantile German perspective • Specific Asset Values (stochastically evaluated) German perspective • Example Wupper (BMBF REISE) 1. Land use data (ATKIS-Basis-DLM): 2. Raster data: Resolution 25m x 25m per grid cell => Considered catchment area 282km2 (467.200 Elements) Open Questions 0. national / partially common/ common approach 1. Monetary-/ Qualitative Assessment 2. Separate consideration flood losses/drought losses 3. Direct flood losses mobile/immobile 4. Land use data 5. Determination of Land use categories 6. Flood damage functions/which hydraulic input variables (t/h/v…) 7. Assessment of direct/indirect losses Open Questions 1. Separate consideration flood losses/drought losses - Existing damage functions in flood damage assessment Open Questions 2. Land use data? - Suggestion CORINE data Advantage Disadvantage: - Available Europe wide - Free download - Aggregation of damage categories - Only 5 category groups (Artificial Surfaces, Agricultural Areas, Forest and semi natural areas, wetlands, water bodies) - Resolution (100m x 100m) http://www.eea.europa.eu/data-and maps/data#c5=all&c0=5&b_start=0&c11 =landuse => more inaccurate than ATKIS Data (German Approach) CORINE categories Open Questions 3. Aggregation of Land use data to Categories => CORINE Land use groups? Artificial Surfaces Agricultural Areas Forest and semi natural areas Wetlands Water bodies others Open Questions 4. Indirect flood losses? - Partially approaches exist but not tested - Data availability? - Time frame / Budget? low flow losses • Considered disciplines in AMICE project • Navigation • Agriculture • Water supply (drinking water) • Energy • Average discharge of the Meuse: Q = 230 m3/s • Decrease of discharge to Q = 130 m3/s => economic problems occur (Woelders, Keizer; 2007) • Decrease of discharge below Q = 1100 m3/s (water gauge Lobhit) sluices enclosed? Low flow losses • Assessment of low flow situations Region Wallonia (GxABT) Agriculture Public Water supply Navigation Energy X Wallonia (HACH) France (EPAMA) Flanders (FHR) Netherlands (RWS) Germany (IWW) X Evaluation of low flow losses • Navigation: Information questionnaire Region Wallonia (ULG-GxABT) Monetary / Approach Qualitative Qualitative A decree regulates movements of boats and divers on and in the river. It includes minimum flows needed for activities. Evaluation of low flow losses • Energy: Information questionnaire Region Monetary/ Qualitative Approach Netherlands (RWS) monetary Cost functions using the difference between actual water temperature and optimal or maximum water temperature is used. Evaluation of low flow losses • Literature research examples: Agriculture Title/Author/ Model Monetary / Approach Qualitative Palmer Drought Severity Index Qualitative Evaluation of the divergence of normal conditions in respect to precipitation, evapotranspiration and soil moisture on a time scale of month. Economic drought Management Index Qualitative Cost – benefit ratio about reducing drought risk for different water rates Aqua Crop Monetary Estimation of crop yield. Due to the respective market prices a monetary assessment is possible. WEAP-Model Monetary Estimation of crop yield. Due to the respective market prices a monetary assessment is possible. => Important parameter to assess low flow losses in agriculture: Available Soil moisture content Evaluation of low flow losses • Palmer drought severity index (PDSI): - Widely used in the USA - PDSI is based on a supply-and-demand model of soil moisture - Algorithm based on most readily data: precipitation and temperature - Qualitative Assessment - Time scale Month (What do we need?) Evaluation of low flow losses • Palmer drought severity index (PDSI): 1 PDSI i 0,897 PDSI i 1 Zi 3 Evaluation of variance to „normal“ conditions Time scale of months Zi: value of the moisture anomaly Zi Ki D K: Weighting factor for spatial variability D: Difference between actual precipitation and CAFEC precipitation DPP CAFEC (Climatically Appropriate For Existing Conditions) precipitation: P i PE i PR i PRO i PL i ETi R RO i L ;i i ; i ; i i PEi PR i PROi PLi ET: Evapotranspiration PE: Potential ET R : Runoff PR: Potential Runoff L : Loss PL. Potential Loss Evaluation of low flow losses • Palmer drought severity index (PDSI): Advantage: Easy to handle; Data availability Disadvantage: strongly simplification, Qualitative assessment Evaluation of low flow losses • Aqua Crop: - AquaCrop is a product of FAO (Food and Agriculture Organization of the United Nations) - Simulation model to determine the required amount of water for a specific crop yield - FAO crop requirements are calculated assuming a demand site with simplified hydrological agro-hydrological processes such as precipitation, evapotranspiration and crop growth - The FAO Agriculture Approach is widely used in other water management models e.g. WEAP (Water Evaluation And Planning System) Evaluation of low flow losses • Parameters FAO Approach Input Parameters Output Parameters Area [ha] Area [ha] Kc [-] Evaporation Coefficient Kc [-] Evaporation Coefficient Effective Precipitation [mm] Percentage of Precipitation for Evapotranspiration Runoff from Precipitation [Million cm³] Precipitation [mm] Observed Precipitation [mm] ETRef [mm] Infiltration/Runoff flow [Million cm³] Potential Yield [kg/ha] ETPotential [Million cm³] Yield Response Factor [-] ETActual (including irrigation) [Million cm³] Market Price [€/kg] ETShortfall [Million cm³] Irrigated [-] Total Yield [kg/ha] Irrigation Fraction [%] Total Market Value [€] Evaluation of low flow losses • FAO Approach Advantage Disadvantage Available Input Parameters from hydrologic models No validated model existing No Experience Evaluation of low flow losses • Public Water supply: Literature Research Titel/Author Monetary/ Qualitative Approach Antonino Canvcelliere, Vincenzo Nicolosi, Giuseppe Rossi Qualitative Assessment of the water supply system via the factors. Temporal Reliability: n rel t s ns: Intervals, demand is fully met N N: total number of intervals N Rt Volumetric reliability: (Ratio between the total volume released and the total demand volume) rel V t 1 Average shortage period length: ns: Intervals, demand is fully met N: total number of intervals NP: number of sequent periods with deficits A Vdef => Water availability – demand approach is required N Dt t 1 N ns NP Evaluation of low flow losses • Public Water supply: Literature Research Titel/Author Monetary/ Qualitative Approach KENJI JINNO, XU ZONGXUE, AKIRA KAWAMURA & KANAME TAJIRI Qualitative Assessment of the water supply system via the 1 NS factors. Ii NS i 1 NS: days of period Reliability α: I state variable Resiliency β: Risk Assessment of a Water Supply System during Drought 1 1 N FPt NF t 1 N Vulnerability γ: VE t t 1 N VD t VE: water deficit VD: water demand during deficit t 1 Drought Risk Index (DRI): 1 (1 ) 2 (1 ) 3 DRI = 1 => high drought risk DRI = 0 => no drought risk - HEC-PRN => Water Balance Models proposed - Aquatool - MODSIM - STELLA Evaluation of low flow losses • Navigation: Literature Research Titel/Author Monetary / Qualitative Effects of low Monetary water levels on the river Rhine on the inland waterway transport sector Olaf Jonkeren; Jos van Ommeren; Piet Rietveld; Approach Relationship between price per ton and the transport capacity due to the water level Evaluation of low flow losses • Energy: Literature Research Title/Author Monetary/ Qualitative Approach Jack Sieber; David Purkey WEAP-Model monetary Quantifying Hydropower generation due to produced Energy depending on hydraulic potential. P = Q*μ*ρ*g*h Deviation to average (year) power generation of water power plant is calculated. Absolute monetary assessment by energy price => Cooling water demands low flow losses • Water Management Models available Region Available data Wallonia (GxABT) EPICGrid model Wallonia (HACH) France (EPAMA) Flanders (FHR) MIKEBASIN Netherlands (RWS) PAWN-Model Germany (IWW) Evaluation of low flow losses • Water Management Models used by AMICE partners Region Model Practicability Input data Wallonia (GxABT) EPIC grid model Applicable for the agriculture, this model can highlight inland water stress and produce raster maps (resolution 1km²) Soil, weather, Agricultural practices, DTM (readily availabl for Wallonia from 1961 to 2005) Flandern (FHR) MIKEBASiN easy to use in itself, but when management rules are to be implemented, extra programming is needed to send the water where you want it rainfall, evaporation, withdrawals, discharges, navigation, river/canal discharges, water levels managment rules, economic loss curves (nearly all fluxes in and out the surface water system) Evaluation of low flow losses • Water Management Models used by AMICE partners Region Model Practicability Input data Netherlands (RWS) PAWNModel PAWN toolbox is used. NHI is currently under development. Consists of a hydrological modeling toolbox and effect models. He effect models include AGRICOM for agriculture, DEMNAT for terrestrial nature, BIVAS for shipping and a cooling water model. The shipping model is a cost model that indicates additional costs when water levels go down. The number of ship movements is taken into account for. The cooling water model is used to calculate potential cooling capacity for each power plant in the Netherlands. The capacity is taken as the difference between the maximum allowed temperature and the river water temperature at the location. Some modules can be used separately from The hydrological toolbox, but do need a detailed input. Input: Time series from hydrological models (e.g. SOBEK and distribution model) Open Questions 1. Approaches to assess risk due to Low Flow Open Questions 1. Separate consideration flood losses/drought losses - Available soil water content (agriculture) Suggestion: Task group (LOW FLOW) 1. Navigation - Rijkswaterstaat (Netherlands) - De Scheepvart (Belgium) - IWW (Germany) 2. Agriculture - FUSAGx (Wallonia) - FHR - IWW (Germany) 3. Public Water Supply - IWW - AWW - FHR 4. Energy - EPAMA (French) - Wallonia Region - IWW (Germany) Data Collection? (Example) 1. Navigation - Quantity of ships navigating the Meuse in a defined time scale - Price per tons 2. Agriculture - Agriculture areas in the Meuse basin - Market prices of specific crops 3. Public Water Supply - Wherefrom is drinking water taken? 4. Energy - Temperature threshold values for cooling circuits - Water demand of power plant (e.g. l/kwh)


