View ePoster - 2015 AGU Fall Meeting
advertisement
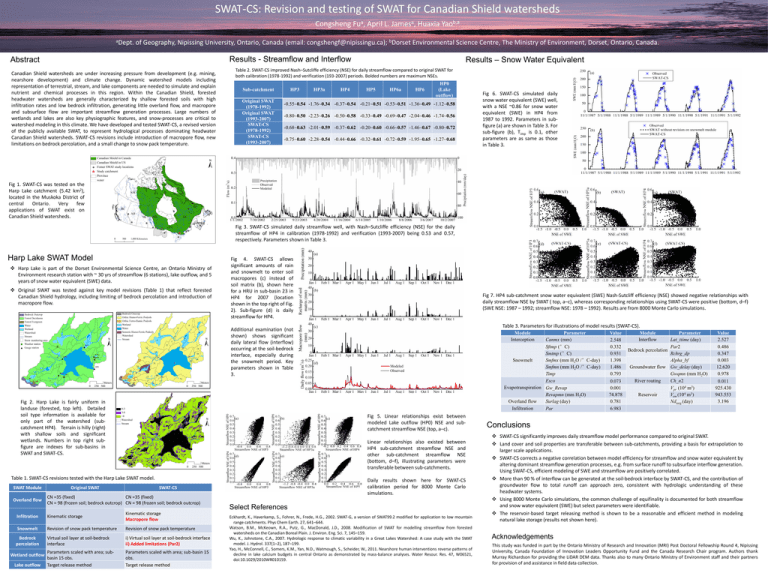
SWAT-CS: Revision and testing of SWAT for Canadian Shield watersheds Congsheng Fua, April L. Jamesa, Huaxia Yaob,a aDept. of Geography, Nipissing University, Ontario, Canada (email: congshengf@nipissingu.ca); bDorset Environmental Science Centre, The Ministry of Environment, Dorset, Ontario, Canada. Results – Snow Water Equivalent Results - Streamflow and Interflow Abstract Canadian Shield watersheds are under increasing pressure from development (e.g. mining, nearshore development) and climate change. Dynamic watershed models including representation of terrestrial, stream, and lake components are needed to simulate and explain nutrient and chemical processes in this region. Within the Canadian Shield, forested headwater watersheds are generally characterized by shallow forested soils with high infiltration rates and low bedrock infiltration, generating little overland flow, and macropore and subsurface flow are important streamflow generation processes. Large numbers of wetlands and lakes are also key physiographic features, and snow-processes are critical to watershed modeling in this climate. We have developed and tested SWAT-CS, a revised version of the publicly available SWAT, to represent hydrological processes dominating headwater Canadian Shield watersheds. SWAT-CS revisions include introduction of macropore flow, new limitations on bedrock percolation, and a small change to snow pack temperature. Table 2. SWAT-CS improved Nash–Sutcliffe efficiency (NSE) for daily streamflow compared to original SWAT for both calibration (1978-1992) and verification (193-2007) periods. Bolded numbers are maximum NSEs. Sub-catchment Original SWAT (1978-1992) Original SWAT (1993-2007) SWAT-CS (1978-1992) SWAT-CS (1993-2007) HP3 HP3a HP4 HP5 HP6a HP6 HP0 (Lake outflow) -0.55~0.54 -1.76~0.34 -0.37~0.54 -0.21~0.51 -0.53~0.51 -1.36~0.49 -1.12~0.58 -0.80~0.50 -2.23~0.26 -0.50~0.58 -0.33~0.49 -0.69~0.47 -2.04~0.46 -1.74~0.56 -0.68~0.63 -2.01~0.59 -0.37~0.62 -0.20~0.60 -0.66~0.57 -1.46~0.67 -0.80~0.72 -0.75~0.60 -2.28~0.54 -0.44~0.66 -0.32~0.61 -0.72~0.59 -1.95~0.65 -1.27~0.68 Fig 6. SWAT-CS simulated daily snow water equivalent (SWE) well, with a NSE ~0.86 for snow water equivalent (SWE) in HP4 from 1987 to 1992. Parameters in subfigure (a) are shown in Table 3. For sub-figure (b), Timp is 0.1, other parameters are as same as those in Table 3. Fig 1. SWAT-CS was tested on the Harp Lake catchment (5.42 km2), located in the Muskoka District of central Ontario. Very few applications of SWAT exist on Canadian Shield watersheds. Fig 3. SWAT-CS simulated daily streamflow well, with Nash–Sutcliffe efficiency (NSE) for the daily streamflow of HP4 in calibration (1978-1992) and verification (1993-2007) being 0.53 and 0.57, respectively. Parameters shown in Table 3. Harp Lake SWAT Model Harp Lake is part of the Dorset Environmental Science Centre, an Ontario Ministry of Environment research station with ~ 30 yrs of streamflow (6 stations), lake outflow, and 5 years of snow water equivalent (SWE) data. Original SWAT was tested against key model revisions (Table 1) that reflect forested Canadian Shield hydrology, including limiting of bedrock percolation and introduction of macropore flow. Fig 4. SWAT-CS allows significant amounts of rain and snowmelt to enter soil macropores (c) instead of soil matrix (b), shown here for a HRU in sub-basin 23 in HP4 for 2007 (location shown in the top right of Fig. 2). Sub-figure (d) is daily streamflow for HP4. Fig 7. HP4 sub-catchment snow water equivalent (SWE) Nash-Sutcliff efficiency (NSE) showed negative relationships with daily streamflow NSE by SWAT ( top, a–c), whereas corresponding relationships using SWAT-CS were positive (bottom, d–f) (SWE NSE: 1987 – 1992; streamflow NSE: 1978 – 1992). Results are from 8000 Monte Carlo simulations. Table 3. Parameters for illustrations of model results (SWAT-CS). Additional examination (not shown) shows significant daily lateral flow (interflow) occurring at the soil-bedrock interface, especially during the snowmelt period. Key parameters shown in Table 3. Fig 2. Harp Lake is fairly uniform in landuse (forested, top left). Detailed soil type information is available for only part of the watershed (subcatchment HP4). Terrain is hilly (right) with shallow soils and significant wetlands. Numbers in top right subfigure are indexes for sub-basins in SWAT and SWAT-CS. Overland flow Original SWAT Linear relationships also existed between HP4 sub-catchment streamflow NSE and other sub-catchment streamflow NSE (bottom, d–f), illustrating parameters were transferable between sub-catchments. Daily results shown here for SWAT-CS calibration period for 8000 Monte Carlo simulations. SWAT-CS CN =35 (fixed) CN =35 (fixed) CN = 98 (frozen soil; bedrock outcrop) CN = 98 (frozen soil; bedrock outcrop) Infiltration Kinematic storage Kinematic storage Macropore flow Snowmelt Revision of snow pack temperature Revision of snow pack temperature Bedrock percolation Virtual soil layer at soil-bedrock interface i) Virtual soil layer at soil-bedrock interface ii) Added limitations (Par2) Parameters scaled with area; subWetland outflow basin 15 obs. Lake outflow Target release method Parameter Canmx (mm) Sftmp (°C) Smtmp (°C) Snowmelt Smfmx (mm H2O /°C-day) Smfmn (mm H2O /°C-day) Timp Esco Evapotranspiration Gw_Revap Revapmn (mm H2O) Overland flow Surlag (day) Infiltration Par Fig 5. Linear relationships exist between modeled Lake outflow (HP0) NSE and subcatchment streamflow NSE (top, a–c). Table 1. SWAT-CS revisions tested with the Harp Lake SWAT model. SWAT Module Module Interception Parameters scaled with area; sub-basin 15 obs. Target release method Select References Eckhardt, K., Haverkamp, S., Fohrer, N., Frede, H.G., 2002. SWAT-G, a version of SWAT99.2 modified for application to low mountain range catchments. Phys Chem Earth. 27, 641–644. Watson, B.M., McKeown, R.A., Putz, G., MacDonald, J.D., 2008. Modification of SWAT for modelling streamflow from forested watersheds on the Canadian Boreal Plain. J. Environ. Eng. Sci. 7, 145–159. Wu, K., Johnstone, C.A., 2007. Hydrologic response to climatic variability in a Great Lakes Watershed: A case study with the SWAT model. J. Hydrol. 337(1–2), 187–199. Yao, H., McConnell, C., Somers, K.M., Yan, N.D., Watmough, S., Scheider, W., 2011. Nearshore human interventions reverse patterns of decline in lake calcium budgets in central Ontario as demonstrated by mass-balance analyses. Water Resour. Res. 47, W06521, doi:10.1029/2010WR010159. Value 2.548 0.332 0.931 1.398 1.486 0.793 0.073 0.001 74.878 0.781 6.983 Module Interflow Parameter Lat_ttime (day) Par2 Bedrock percolation Rchrg_dp Alpha_bf Groundwater flow Gw_delay (day) Gwqmn (mm H2O) River routing Ch_n2 Vpr (104 m3) Reservoir Vem (104 m3) Ndtarg (day) Value 2.527 0.486 0.347 0.003 12.620 0.978 0.011 925.430 943.553 3.196 Conclusions SWAT-CS significantly improves daily streamflow model performance compared to original SWAT. Land cover and soil properties are transferable between sub-catchments, providing a basis for extrapolation to larger scale applications. SWAT-CS corrects a negative correlation between model efficiency for streamflow and snow water equivalent by altering dominant streamflow generation processes, e.g. from surface runoff to subsurface interflow generation. Using SWAT-CS, efficient modeling of SWE and streamflow are positively correlated. More than 90 % of interflow can be generated at the soil-bedrock interface by SWAT-CS, and the contribution of groundwater flow to total runoff can approach zero, consistent with hydrologic understanding of these headwater systems. Using 8000 Monte Carlo simulations, the common challenge of equifinality is documented for both streamflow and snow water equivalent (SWE) but select parameters were identifiable. The reservoir-based target releasing method is shown to be a reasonable and efficient method in modeling natural lake storage (results not shown here). Acknowledgements This study was funded in part by the Ontario Ministry of Research and Innovation (MRI) Post Doctoral Fellowship Round 4, Nipissing University, Canada Foundation of Innovation Leaders Opportunity Fund and the Canada Research Chair program. Authors thank Murray Richardson for providing the LiDAR DEM data. Thanks also to many Ontario Ministry of Environment staff and their partners for provision of and assistance in field data collection.
