WHAT IS PHYSICS?
advertisement
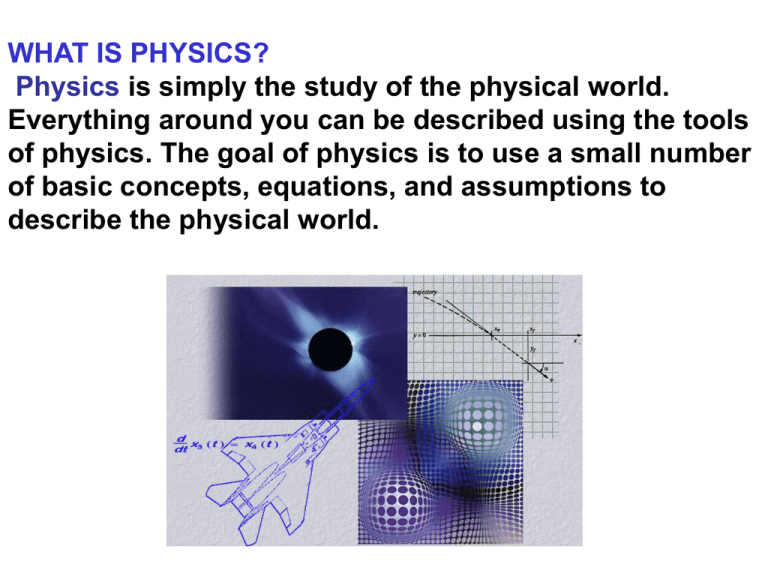
WHAT IS PHYSICS? Physics is simply the study of the physical world. Everything around you can be described using the tools of physics. The goal of physics is to use a small number of basic concepts, equations, and assumptions to describe the physical world. Once the physical world has been described this way, the Physics principles involved can be used to make predictions about a broad range of phenomena. For example, the same Physics principles that are used to describe the interaction between two planets can also be used to describe the motion of a satellite orbiting the Earth. Many of the inventions, appliances, tools, and buildings we live with today are made possible by the application of physics principles. Every time you take a step, catch a ball, open a door, whisper, or check your image in a mirror, you are unconsciously using your knowledge of Physics. Physics is the most basic of the experimental sciences. and provides the foundation for other scientific and technical disciplines. There are five major areas in Physics: 1. Newtonian Mechanics Kinematics: How objects move. Dynamics: The causes of motion: Newton's Laws. Circular motion and Gravitation Conservations Laws: Energy and Momentum Oscillations 2. Fluid Mechanics and Thermodynamics Fluid Mechanics: Fluids at rest and fluids in motion. Thermodynamics: The relationship between heat and other properties. 3. Electricity and Magnetism Electrostatics: Electric charge, field and potential. DC Circuits: Electric current and direct-current circuits. Electromagnetism: Magnetic force and electromagnetic induction 4. Waves and Optics Wave motion. Geometric Optics: reflection, refraction and optical devices (mirrors and lenses). Physical Optics: interference and diffraction. 5. Atomic and Nuclear Physics Atomic levels, photoelectric effect, radioactivity, fission and fusion. UNITS, STANDARDS AND THE SI SYSTEM The base units that will be used in this course are: meter, kilogram, second The SI length standard: the meter meter (m): One meter is equal to the path length traveled by light in vacuum during a time interval of 1/299,792,458 of a second. The SI mass standard: the kilogram kilogram (kg): One kilogram is the mass of a Platinum-Iridium cylinder kept at the International Bureau of Weights and Measures in Paris. The SI time standard: the second second (s): One second is the time occupied by 9,192,631,770 vibrations of the light (of a specified wavelength) emitted by a Cesium133 atom. SYSTEME INTERNATIONAL The scientific community follows the SI Systeme International, based on the metric system: All physical quantities are expressed in terms of base units. For example, velocity is usually given in units of m/s. All other units are derived units and may be expressed as a combination of base units. For example: A Newton is a unit of force: 1 N = 1 kg.m/s2 SI PREFIXES MATHEMATICAL NOTATION Many mathematical symbols will be used throughout this course: = denotes equality of two quantities denotes a proportionality < means is less than and > means greater than two quantities are approximately equal to each other x (read as “delta x”) indicates the change in the quantity x represents a sum of several quantities, also called summation (sum of…) PART I. SOLVING EQUATIONS BASIC ALGEBRA: adding subtracting multiplying dividing squared square root v v 2a( s so ) 2 2 o v v 2a( s so ) 2 2 o v v a 2( s so ) 2 2 o PART II. SCIENTIFIC NOTATION The following are ordinary Physics problems. Place the answer in scientific notation when appropriate and simplify the units. 4.5 10-2 kg -2 s Ts 2 2.98x10 2.0 103 kg s 2 PART III. FACTOR-LABEL METHOD FOR CONVERTING UNITS Change 25 km/h to m/s 25 km 1000 m 1 h h 1 km 3600 s = 6.94 m/s What is the conversion factor to convert km/h to m/s? DIVIDE BY 3.6 What is the conversion factor to convert m/s to km/h? MULTIPLY BY 3.6 PART IV. TRIGONOMETRY AND BASIC GEOMETRY SOH CAH TOA opp b sin hyp c c a b 2 2 2 adj a cos hyp c opp b tan adj a 1. c = 32 m b b sin 55 c 55º a b csin 55 32(sin 55 ) = 26.2 m c a b 2 2 2 a c b 2 2 322 26.22 = 18.4 m a = 18.4 m b = 26.2 m GRAPHING TECHNIQUES Frequently an investigation will involve finding out how changing one quantity affects the value of another. The quantity that is deliberately manipulated is called the independent variable. The quantity that changes as a result of the independent variable is called the dependent variable. 1. Identify the independent and dependent variables: Time = independent Position = dependent 2. Choose your scale carefully: 5 cm = 1 unit 3. Plot the independent variable on the horizontal (x) axis and the dependent variable on the vertical (y) axis. 4. If the data points appear to lie roughly in a straight line, draw the best straight line you can with a ruler and a sharp pencil. 5. Title your graph. 6. Label each axis with the name of the variable and the unit. INTERPRETING GRAPHS There are three relationships that occur frequently in Physics. Graph A: If the dependent variable varies directly with the independent variable, the graph will be a straight line. Graph B: If y varies inversely with x, the graph will be a hyperbola. Graph C: If y varies directly with the square of x, the graph will be a parabola. Reading from the graph between data points is called interpolation. Reading from the graph beyond the limits of your experimentally determined data points is called extrapolation. 1. Suppose you recorded the following data during a study of the relationship of force and acceleration. Prepare a graph showing these data. a. Describe the relationship between force and acceleration as shown by the graph. Force is directly proportional to acceleration b. What is the slope of the graph? 2 y 40 10 30 kg×m/s slope = 1.57 kg 2 25 6 x 19 m/s c. What physical quantity does the slope represent? The slope represents the mass. d. Write an equation for the line. y = kx + b F =ma + 0 e. What is the value of the force for an acceleration of 15 m/s2? F = ma + 0 = (1.57 kg) (15 m/s2) = 24 N f. What is the acceleration when the force is 50.0 N? F =ma + 0 F 50 kg m/s 2 a 31.8 m/s 2 m 1.57 kg EXPERIMENTAL ERROR When scientists measure a physical quantity, they do not expect the value they obtain to be exactly equal to the true value. Measurements can never be made with complete precision. Therefore, there is always some uncertainty in physical quantities determined by experimental observations. This uncertainty is known as experimental error. There are two kinds of errors: systematic error and random error. A systematic error is constant throughout a set of measurements. The results will be either always larger or always smaller than the exact reading. A random error is not constant. Unlike a systematic error, a random error can usually be detected by repeating the measurements. Classify the following examples as systematic or random error. 1. A meterstick that is worn at one end is used to measure the height of a cylinder. 2. A clock used to time an experiment runs slow. 3. Two observers are timing a runner on a track. Observer A is momentarily distracted and starts the stopwatch 0.5 s after observer B. 4. Friction causes the pointer on a balance to stick. 5. An observer reads the scale divisions on a beaker as one-tenths instead of one-hundredths.
