Table 2 - Algorithme Pharma
advertisement
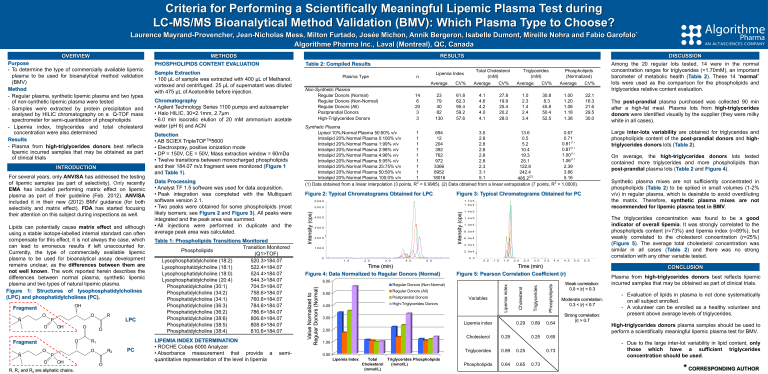
Criteria for Performing a Scientifically Meaningful Lipemic Plasma Test during LC-MS/MS Bioanalytical Method Validation (BMV): Which Plasma Type to Choose? Laurence Mayrand-Provencher, Jean-Nicholas Mess, Milton Furtado, Josée Michon, Annik Bergeron, Isabelle Dumont, Mireille Nohra and Fabio Garofolo* Algorithme Pharma Inc., Laval (Montreal), QC, Canada O N O R P O OH O O Fragment O N O R1 O R2 P O OH R, R1 and R2 are aliphatic chains. LPC O PC LIPEMIA INDEX DETERMINATION • ROCHE Cobas 6000 Analyzer • Absorbance measurement that provide a quantitative representation of the level in lipemia semi- CV% Average CV% Average CV% 23 79 40 82 130 61.8 62.3 95.4 59.2 57.6 4.1 4.6 4.2 4.0 4.1 27.8 19.9 25.4 20.2 28.0 1.0 2.3 1.4 2.4 3.4 30.8 8.3 45.8 50.4 52.5 1.00 1.20 1.06 1.18 1.38 22.1 16.3 21.6 29.5 30.0 14 6 20 3 3 Figure 2: Typical Chromatograms Obtained for LPC T I C o f + T O F P ro d u c t (5 2 0 . 3 ) : E x p 2 , f r o m S a m p le 41 ( S 0 6 ) o f L P I 7 1 3 - 0 2 . w i f f ( D u o S p ra y () ) M a x . 2 1 2 2 .0 cp s. Figure 3: Typical Chromatograms Obtained for PC T I C o f + T O F P ro d u c t (7 0 4 . 5 ) : E x p 6 , f r o m S a m p le 4 1 ( S 0 6 ) o f L P I 7 1 3 - 0 2 . w i f f ( D u o S p ra y () ) M a x . 3 5 9 8 .0 c p s . 1 .6 e 5 3000 2000 The triglycerides concentration was found to be a good indicator of overall lipemia. It was strongly correlated to the phospholipids content (r=73%) and lipemia index (r=89%), but weakly correlated to the cholesterol concentration (r=25%) (Figure 5). The average total cholesterol concentration was similar in all cases (Table 2) and there was no strong correlation with any other variable tested. 1 .2 e 5 1 .0 e 5 8 .0 e 4 6 .0 e 4 4 .0 e 4 2 .0 e 4 0 .0 3 .0 4 .0 5 .0 m e , m in TimeT i(min) Figure 4: Data Normalized to Regular Donors (Normal) 6.00 0 .5 Regular Donors (All) Postprandial Donors Variables High-Triglycerides Donors 4.00 1 .5 2 .0 2 .5 3 .0 3 .5 4 .0 3.00 Lipemia index 0.29 0.89 0.64 0.25 0.65 2.00 Cholesterol 0.29 1.00 Triglycerides 0.89 0.25 Phospholipids 0.64 0.65 0.73 0.00 Lipemia Index Total Triglycerides Phospholipids Cholesterol (mmol/L) (mmol/L) 4 .5 5 .0 5 .5 e , m in TimeT i m(min) Figure 5: Pearson Correlation Coefficient (r) Regular Donors (Non-Normal) 5.00 1 .0 Phospholipids 2 .0 Triglycerides 1 .0 Synthetic plasma mixes are not sufficiently concentrated in phospholipids (Table 2) to be spiked in small volumes (1-2% v/v) in regular plasma, which is desirable to avoid overdiluting the matrix. Therefore, synthetic plasma mixes are not recommended for lipemic plasma test in BMV. 1 .4 e 5 1000 0 The post-prandial plasma purchased was collected 90 min after a high-fat meal. Plasma lots from high-triglycerides donors were identified visually by the supplier (they were milky white in all cases). On average, the high-triglycerides donors lots tested contained more triglycerides and more phospholipids than post-prandial plasma lots (Table 2 and Figure 4). 5000 4000 Among the 20 regular lots tested, 14 were in the normal concentration ranges for triglycerides (<1.70mM), an important barometer of metabolic health (Table 2). These 14 “normal” lots were used as the comparison for the phospholipids and triglycerides relative content evaluation. Large inter-lots variability are obtained for triglycerides and phospholipids content of the post-prandial donors and hightriglycerides donors lots (Table 2). 1 .7 e 5 5595 Cholesterol Fragment Table 1: Phospholipids Transitions Monitored Transition Monitored Phospholipids (Q1>TOF) Lysophosphatidylcholine (18:2) 520.3>184.07 Lysophosphatidylcholine (18:1) 522.4>184.07 Lysophosphatidylcholine (18:0) 524.4>184.07 Lysophosphatidylcholine (20:4) 544.3>184.07 Phosphatidylcholine (30:1) 704.5>184.07 Phosphatidylcholine (34:2) 758.6>184.07 Phosphatidylcholine (34:1) 760.6>184.07 Phosphatidylcholine (36:3) 784.6>184.07 Phosphatidylcholine (36:2) 786.6>184.07 Phosphatidylcholine (38:6) 806.6>184.07 Phosphatidylcholine (38:5) 808.6>184.07 Phosphatidylcholine (38:4) 810.6>184.07 Average Synthetic Plasma 0.67 13.6 3.5 694 1 Lipisol 10%:Normal Plasma 50:50% v/v 0.71 0.5 2.8 12 1 Intralipid 20%:Normal Plasma 0:100% v/v 0.81(1) 5.2 2.8 204 1 Intralipid 20%:Normal Plasma 1:99% v/v 0.87(1) 10.4 2.8 392 1 Intralipid 20%:Normal Plasma 2:98% v/v 1.00(1) 19.3 2.8 762 1 Intralipid 20%:Normal Plasma 4:96% v/v 1.06(1) 25.1 2.8 972 1 Intralipid 20%:Normal Plasma 5:95% v/v 2.39 122.8 2.3 3366 1 Intralipid 20%:Normal Plasma 25:75% v/v 3.86 242.4 3.1 8952 1 Intralipid 20%:Normal Plasma 50:50% v/v 5.16 5.1 18016 1 Intralipid 20%:Normal Plasma 100:0% v/v 485.2(2) (1) Data obtained from a linear interpolation (3 points, R2 = 0.9985). (2) Data obtained from a linear extrapolation (7 points, R2 = 1.0000). Detection • AB SCIEX TripleTOFTM5600 • Electrospray, positive ionization mode • DP = 150V, CE = 50V, Mass extraction window = 60mDa • Twelve transitions between monocharged phospholipids and their 184.07 m/z fragment were monitored (Figure 1 and Table 1). Data Processing • Analyst TF 1.5 software was used for data acquisition. • Peak integration was completed with the Multiquant software version 2.1. • Two peaks were obtained for some phospholipids (most likely isomers; see Figure 2 and Figure 3). All peaks were integrated and the peak area was summed. • All injections were performed in duplicate and the average peak area was calculated. CV% Lipemia index OH Chromatography • Agilent Technology Series 1100 pumps and autosampler • Halo HILIC, 30×2.1mm, 2.7µm • 6.0 min isocratic elution of 20 mM ammonium acetate water (pH 6) and ACN Average In te n s ity , c p s Lipids can potentially cause matrix effect and although using a stable isotope-labelled internal standard can often compensate for this effect, it is not always the case, which can lead to erroneous results if left unaccounted for. Currently, the type of commercially available lipemic plasma to be used for bioanalytical assay development remains unclear, as the differences between them are not well known. The work reported herein describes the differences between normal plasma, synthetic lipemic plasma and two types of natural lipemic plasma. Figure 1: Structures of lysophosphatidylcholines (LPC) and phosphatidylcholines (PC). Non-Synthetic Plasma Regular Donors (Normal) Regular Donors (Non-Normal) Regular Donors (All) Postprandial Donors High-Triglycerides Donors Phospholipids (Normalized) Triglycerides (mM) Total Cholesterol (mM) Lipemia Index n Plasma Type In te n s ity , c p s For several years, only ANVISA has addressed the testing of lipemic samples (as part of selectivity). Only recently EMA has included performing matrix effect on lipemic plasma as part of their guideline (Feb. 2012). ANVISA included it in their new (2012) BMV guidance (for both selectivity and matrix effect). FDA has started focusing their attention on this subject during inspections as well. Sample Extraction • 100 µL of sample was extracted with 400 µL of Methanol, vortexed and centrifuged. 25 µL of supernatant was diluted with 475 µL of Acetonitrile before injection. Intensity (cps) INTRODUCTION DISCUSSION Table 2: Compiled Results Intensity (cps) Purpose - To determine the type of commercially available lipemic plasma to be used for bioanalytical method validation (BMV) Method - Regular plasma, synthetic lipemic plasma and two types of non-synthetic lipemic plasma were tested - Samples were extracted by protein precipitation and analysed by HILIC chromatography on a Q-TOF mass spectrometer for semi-quantitation of phospholipids - Lipemia index, triglycerides and total cholesterol concentration were also determined Results - Plasma from high-triglycerides donors best reflects lipemic incurred samples that may be obtained as part of clinical trials RESULTS METHODS PHOSPHOLIPIDS CONTENT EVALUATION Value Normalized to Regular Donors (Normal) OVERVIEW 0.73 Weak correlation: 0.0 < |r| < 0.3 Moderate correlation: 0.3 < |r| < 0.7 Strong correlation: |r| > 0.7 CONCLUSION Plasma from high-triglycerides donors best reflects lipemic incurred samples that may be obtained as part of clinical trials. - Evaluation of lipids in plasma is not done systematically on all subject enrolled. - A volunteer can be enrolled as a healthy volunteer and present above average levels of triglycerides. High-triglycerides donors plasma samples should be used to perform a scientifically meaningful lipemic plasma test for BMV. - Due to the large inter-lot variability in lipid content, only those which have a sufficient triglycerides concentration should be used. * CORRESPONDING AUTHOR

