KU - Eudora Schools
advertisement
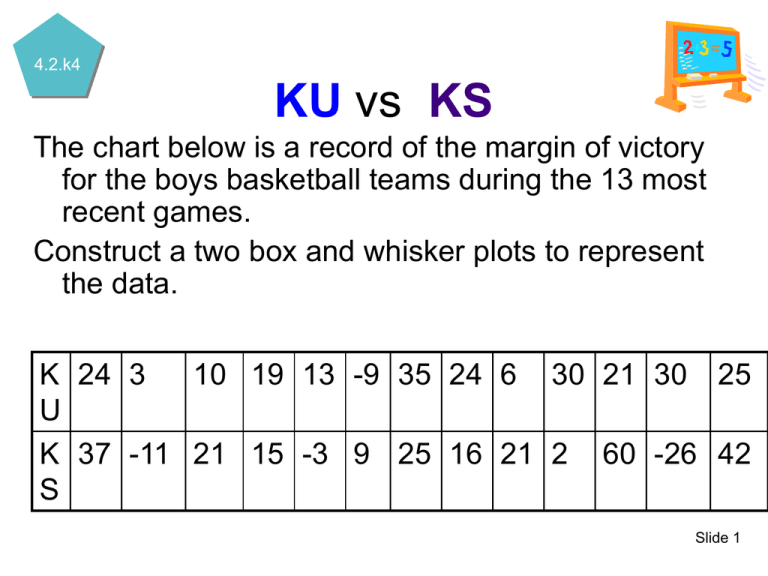
4.2.k4 KU vs KS The chart below is a record of the margin of victory for the boys basketball teams during the 13 most recent games. Construct a two box and whisker plots to represent the data. K 24 3 10 19 13 -9 35 24 6 30 21 30 25 U K 37 -11 21 15 -3 9 25 16 21 2 60 -26 42 S Slide 1 4.2.k4 KU vs KS K 24 3 10 19 13 -9 35 24 6 30 21 30 25 U K 37 -11 21 15 -3 9 25 16 21 2 60 -26 42 S Order the numbers. KU KS Slide 2 4.2.k4 KU vs KS In each set identify the median, upper quartile, lower quartile, upper extreme, lower extreme. KU -9, 3, 6, 10, 13, 19, 21, 24, 24, 25, 30, 30, 35 KS -26, -11, -3, 2, 9, 15, 16, 21, 21, 25, 37, 42, 60 Slide 3 KU vs KS 4.2.k4 In each set identify the median(Q2), upper quartile(Q3), lower quartile(Q1), upper extreme, lower extreme. KU -9, 3, 6, 10, 13, 19, 21, 24, 24, 25, 30, 30, 35 27.5 8 KS -26,-11,-3, 2, 9, 15, 16, 21, 21, 25, 37, 42, 60 -0.5 -20 -10 31 0 10 20 30 40 50 60 | | | | | | | | | | | | | | | | | | | | | | | | | | | | | | | | | | | | | | | | | | | | | Slide 4 KU vs KS 4.2.k4 In each set identify the median(Q2), upper quartile(Q3), lower quartile(Q1), upper extreme, lower extreme. KU -9, 3, 6, 10, 13, 19, 21, 24, 24, 25, 30, 30, 35 27.5 8 KS -26,-11,-3, 2, 9, 15, 16, 21, 21, 25, 37, 42, 60 -0.5 -20 -10 31 0 10 20 30 40 50 60 | | | | | | | | | | | | | | | | | | | | | | | | | | | | | | | | | | | | | | | | | | | | | Slide 5 KU vs KS 4.2.k4 If you drop the lowest margin of error for each team how does that affect the mean, medain and mode. KU -9, 3, 6, 10, 13, 19, 21, 24, 24, 25, 30, 30, 35 KS -26, -11, -3, 2, 9, 15, 16, 21, 21, 25, 37, 42, 60I KU After KS Before After Mean 17.8 Median 21 19.9 22.5 Mean 16 19.5 Median 16 18.5 Mode 24,30 Mode 21 Before 24,30 21 Slide 6 KU vs KS 4.2.k4 Which central tendency was effected by the change the most? KU After KS Before After Mean 17.8 Median 21 19.9 22.5 Mean 16 19.5 Median 16 18.5 Mode 24,30 Mode 21 Before 24,30 21 Slide 7 Teaching Concept #1 4.2.k4 Box-and-Whisker Plots Use the data to make a box and whisker plot. 3, 6, 7, 7, 2, 8, 3, 9, 11, 10, 9, 3, 4, 12, 2, 14, 7, 5, 10 • Order the data: • • • • 2,2,3,3,3,4,5,6,7,7,7,8,8,9,10,10,11,12,14 Find the median and the medians of the upper and lower halves: 3, 7, 10. Check whether extremes are outliers. Plot the five values (minimum, maximum and the three quartiles). Draw the box and whiskers. ●● 0 ● 5 ● 10 ● 15 20 Slide 8 Teaching Concept #2 4.2.k4 Calculate Mean, Median, and Mode Use the data below. 2, 2, 3, 3, 3, 4, 5, 6, 7, 7, 7, 8, 8, 9, 10, 10, 11, 12, 14 Median – Middle number in ordered list or; if even number of elements, average of two middle numbers. Thus, 7. Mean – Sum of all elements divided by the number of elements. Thus, 131/19 ≈ 6.9. Mode – Element that occurs most often. Thus, 3 and 7. ●● 0 ● 5 ● 10 ● 15 20 Slide 9 Teaching Concept #3 4.2.k4 Calculate Range and Inter-Quartile Range Use the data below. 2, 2, 3, 3, 3, 4, 5, 6, 7, 7, 7, 8, 8, 9, 10, 10, 11, 12, 14 Range – Maximum minus minimum. Thus, 14 - 2 = 12. IQR – Difference in 3rd and 1st Quartiles. Thus 10 - 3 = 7. ●● 0 ● 5 ● 10 ● 15 20 Slide 10 Application 4.2.k4 Application The scores on Carl’s test in algebra are 73,68,93,82, and 79. His grade is assigned according to the mean of his test scores. What is his current grade? 73 + 68 + 93 + 82 + 79 = 395 395 / 5 = 79 Slide 11 Concrete Example #1 4.2.k4 Effects of Outliers Find the mean, median, mode, range, and IRQ. Step 1: Order the data 68, 73, 79, 82, 93. Step 2: Find the median and the medians of the upper and lower halves. Median - 79, Lower Quartile - 70.5, Upper Quartile - 87.5. Step 3: Check for outliers. No outliers right now. Step 4:Plot the five and draw the box and whisker plot. ● ● 60 70 ● 80 ● ● 90 100 Slide 12 Concrete Example #1 4.2.k4 Effects of Outliers Make a box and whisker plot for Carl’s scores – 73,68,93,82, & 79 Step 1: 68, 73, 79, 82, 93 Step 2: Median – 79 Lower Quartile – 70.5 Upper Quartile – 87.5 Step 3: No outliers Step 4: Draw the plot. ● ● 60 70 ● 80 Mean = 395/5 = 79 Median = 79 No mode Range = 93 - 68 = 25 IQR = 87.5 – 70.5 = 17 ● ● 90 100 Slide 13 Concrete Example #2 4.2.k4 Effects of Outliers Carl was absent the day they took the last test. If he doesn’t make it up, how would a zero affect his grade? Recreate the box and whisker plot adding in the zero on his test. Step 1: 0, 68, 73, 79, 82, 93 Step 2: Median - 76 Lower Quartile – 36.5 Upper Quartile – 86 Step 3: Yes, 0 is an outlier Step 4: Draw the plot. ● 0 ● 25 ● 50 75 ● ● 100 Slide 14 Concrete Example #2 4.2.k4 Effects of Outliers Find the mean, median, mode, range, and IQR. Mean = 395/6 = 65.8 Median = 76 No mode Range = 93 – 0 = 93 IQR = 86 – 36.5 = 49.5 Slide 15 Concrete Example #2 4.2.k4 Effects of Outliers Without a zero With a zero Mean = 395/5 = 79 Median = 79 No mode Range = 93 - 68 = 25 Mean = 395/6 = 65.8 Median = 76 No mode Range = 93 - 0 = 93 IQR = 87.5 – 70.5 = 17 IQR = 86 - 36.5 = 49.5 Compare the mean, median, and mode of both scenarios. “Which of the three measures of central tendency was affected the most?” Ouch!!! The mean went down about 13 points Ouch!!! Slide 16 Step-by-Step 4.2.k4 Is it an Outlier? Step 1: Find the inter-quartile range. Step 2: Multiply the IQR by 1.5. Step 3: Subtract the IQR #(1.5) from the first quartile. Any number less than this is an outlier. Step 4: Add the IQR #(1.5) from the third quartile. Any number above this is an outlier. Slide 17 Step-by-Step 4.2.k4 Things to Think About Which measure of central tendency is ALWAYS affected the most by an outlier? The mean. If there is NO outlier, which measure of central tendency is the best description of the data set? The mean. If there is an outlier, which measure of central tendency is the best description of the data set? Probably the median. Slide 18
