Theoretical vs. Practical prob
advertisement
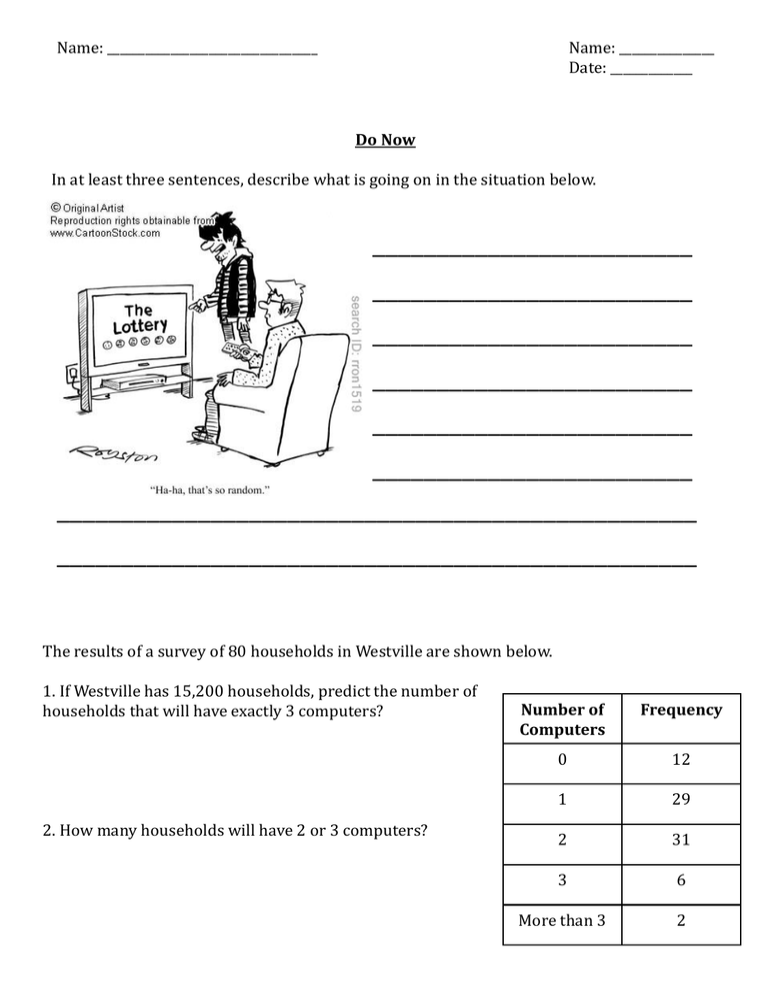
Name: _________________________________ Name: _______________ Date: _____________ Do Now In at least three sentences, describe what is going on in the situation below. _________________________ _________________________ _________________________ _________________________ _________________________ _________________________ __________________________________________________ __________________________________________________ The results of a survey of 80 households in Westville are shown below. 1. If Westville has 15,200 households, predict the number of households that will have exactly 3 computers? 2. How many households will have 2 or 3 computers? Number of Computers Frequency 0 12 1 29 2 31 3 6 More than 3 2 Bourque/Laughton Probability– Day 1 EXPERIMENTAL VS. THEORETICAL PROBABILITY ACTIVITY __________________________________ is a value from 0 to 1 that measures the likelihood of an event. P(event) = number of favorable outcomes number of possible outcomes In this activity, you will investigate the difference between theoretical and experimental probability by tossing a coin. Coin Toss 1. When tossing a coin one time, there are only _____ possible outcomes. What are they? _____________________________________________________ a. P(heads) =________ b. P(tails) =_________ Theoretical Probability If you toss a coin 10 times, how many heads should you get? __________ Percent= How many tails should you get? ___________ Toss 1 Percent= 2 Experimental Probability 3 4 Toss your coin 10 times. Record the number of heads. _________ Percent= 5 6 Toss your coin 10 times. Record the number of tails. _________ 7 Percent= 8 9 2. Did you get the number of heads and the number of tails that you expected when you tossed the coins?_____________________ 10 Result EXPERIMENTAL VS. THEORETICAL _________________________________ probability of an event measures the likelihood that the event occurs based on actual results of an experiment. P(event) = Example 1: A quality control inspector samples 500 LCD monitors and finds defects in three of them. a. What is the experimental probability that a monitor selected at random with have a defect? b. If the company manufactures 15, 240 monitors in a month, how many are likely to have a defect based on the quality inspector’s results? Practice 1: A park has 538 trees. You choose 40 at random and determine that 25 are maple trees. a. What is the experimental probability that a tree chosen at random is a maple tree? b. About how many trees in the park are likely to be maple trees? _________________________________ probability describes the likelihood of an event based on mathematical reasoning. 1 Example 2: You are rolling two dice numbered 1 to 6. What is the probability that you roll numbers that add to 7? 1 2 3 Practice 2: What is the probability that you roll a sum of 9? 4 5 6 2 3 4 5 6 PRACTICE 1. A baseball player got a hit 19 times of his last 64 times at bat. a. What is the experimental probability that the player got a hit? b. If the player comes up to bat 200 times in a season, about how many hits is he likely to get? 2. A medical study tests a new cough medicine on 4,250 people. It is effective for 3982 people. a. What is the experimental probability that the medicine is effective? b. For a group of 9000 people, predict the approximate number of people for whom the medicine will be effective? 3. A bag contains letter tiles that spell the name of the state MISSISSIPPI. Find the theoretical probability of drawing one tile at random for each of the following. a. P(M) = b. P(I) = c. P(S) = d. P(P) = e. P(not M) = f. P(not I) = g. P(not S) = h. P(not P) = PROBABILITY DISTRIBUTIONS AND FREQUENCY TABLES A _________________________________ _______________ is a data display that shows how often an item appears in a category. The table at the below shows the speeds of cars as they pass a certain mile marker on highway 66. The speed limit is 65 mph. a. What is the total number of cars that pass the marker? b. What is the probability that a car stopped at random will be traveling faster than the speed limit? Speed (mph) Number of Cars < 55 2 55 - 60 12 60 - 65 23 > 65 13 _______________________________ _________________________ is the ratio of the frequency of the category of the total frequency. Frequency Example 3: The results of a survey of students’ music Type of Music Preferred preferences are organized in the frequency table to the Rock 10 Hip Hop 7 Country 8 Classical 5 Alternative 6 Other 4 right. What is the relative frequency of preference for rock music? Practice 3: What is the relative frequency of the following? a. Classical b. Hip Hop c. Country PRACTICE 1. A student conducts a probability experiment by tossing 3 coins one after the other. Using the results below, what is the probability that exactly three heads will occur in the next three tosses? Coin Toss Results HHH HHT HTT HTH THH THT TTT TTH Frequency 5 7 9 6 2 9 10 2 2. A student conducts a probability experiment by spinning a spinner divided into parts numbered 1 - 4. Using the results in the frequency table, what is the probability of the spinner pointing at 4 on the next spin? Spinner Result 1 2 3 4 Frequency 29 32 21 18 3. In a recent competition, 50 archers shot 6 arrows each at a target. Three archers hit no bull’s eyes; 7 hit two bull’s eyes; 7 hit three bull’s eyes; 11 hit four bull’s eyes; 10 hit five bull’s eyes; and 7 hit six bull’s eyes. Fill in the table below. Number of Bull’s Eyes Hit 0 Frequency 3 Probability 3/50 1 2 3 4 5 6 1. The table below shows the number of text messages sent in one month by students at Metro High School. Number of Number a. If a student is chosen at random, what is the Texts (t) of probability that the student sends 1500 or Students fewer text messages in one month? t < 500 25 b. If a student is chosen at random, what is the probability that the student sends more than 1500 messages a month? 500 < t < 1500 120 1500 < t < 2500 300 t > 2500 538 Bourque/Laughton Homework 8-1 Name: _________________________________ Date: _______________ Period: _____________ Homework 8-1: Probability 1. Suppose you flip a coin three times, what is the theoretical probability that you flip three heads? 2. A music collection includes 10 rock CDs, 8 country CDs, 5 classical CDs, and 7 hip hop CDs. a. What is the probability that a CD randomly selected from the collection is a classical CD? b. What is the probability that a CD randomly selected from the collection is not a classical CD? 3. You are playing a board game with a standard number cube (numbered 1 – 6). It is your last turn and if you roll a number greater than 2, you will win the game. What is the probability that you will not win the game? 4. If there is a 70% chance of snow this weekend, what is the probability that it will not snow? 5. From 15,000 graphing calculators produced by a manufacturer, an inspector selects a random sample of 450 calculators and finds 4 defective calculators. Estimate the total number of defective calculators out of 15,000. 6. A student randomly selected 65 vehicles in the student parking lot and noted the color of each. She found that 9 were black, 10 were blue, 13 were brown, 7 were green, 12 were red, and 14 were a variety of other colors. What is each experimental probability? a. P(red) = b. P(not blue) = c. P(not green) = 10. The honor society at a local high school sponsors a blood drive. High school juniors and seniors who weigh over 110 pounds may donate. The table at the right indicates the frequency of donor blood type. Blood Type Frequency O 30 A 25 B 6 AB 2 a. What is the relative frequency of blood type AB? b. What is the relative frequency of blood type A? c. Which blood type has the highest relative frequency? What is the relative frequency for this blood type? d. The blood drive is extended for a second day, and the frequency doubles for each blood type. Do the relative frequencies change for each blood type? Explain. 11. Twenty-three preeschoolers were asked what there favorite snacks are. The results are show in the bar graph to the right. a. What is the probability that a preschooler chosen at random chose popcorn as their favorite snack? a. What is the probability that a preschooler chosen at random did not chose bananas as their favorite snack? a. Complete the table below. Snack Popcorn Frequency 6 Probability 6/23 Celery and Cheese Trail Mix Bananas
