PPT - Margins Program
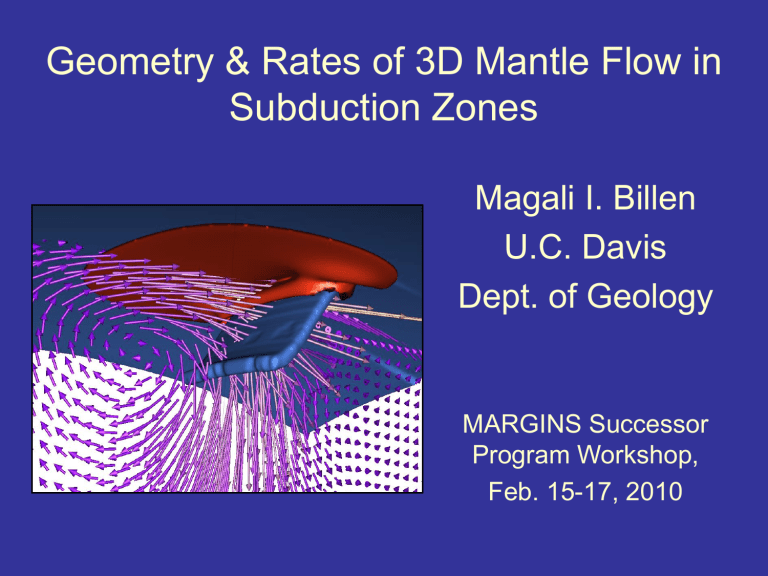
Geometry & Rates of 3D Mantle Flow in
Subduction Zones
Magali I. Billen
U.C. Davis
Dept. of Geology
MARGINS Successor
Program Workshop,
Feb. 15-17, 2010
MARGINS & Geodynamic Modeling
• Models of wedge convection
– Rheology (deformation mechanisms, fabrics, LPO directions, dynamics)
– Fluids, petrology...
– Mostly kinematic slabs & mostly 2D
How will Geodynamics fit into a
MARGINS Successor Program?
1. Develop better tools for...
– 3D & time-dependent models
– Dynamic slabs (evolving trench & slab geometry)
– Coupling & tracking fluid & melt migration flow
– Understanding of special processes
• ie., subduction initiation, slab detachment, flat slabs...
We’re making progress here but it takes time to develop and test the required numerical methods.
How will Geodynamics fit into a
MARGINS Successor Program?
2. Integrate modeling with all stages of
MARGINS research
– Guide deployment of seismic stations, sample collection, etc...
• Region specific models
– Analyze/interpret results from various focus sites
• Generic (process-related) & regional models
– Integrate & interpret multi-disciplinary observations
Two Illustrative Examples
1. Ridge-Trench Interaction
– PhD candidate Erin Burkett
2. 3D Mantle Flow at a Slab Edge
– Margarete Jadamec (PhD 2009)
... illustrate two ways in which geodynamic modeling can be even better integrated into a MARGINS successor program.
Ex. 1: Ridge-Trench Interaction
QuickTime™ and a
decompressor are needed to see this picture.
Burkett & Billen, JGR 2009
Detachments & Plate Strength
• Detachment: integrated strength of subducted lithosphere => less than stress from sinking slab
– plate age & rock yield strength.
Regions With Slab Detachment?
• Costa Rica (continued sub.) & Baja Calif. (halted sub.)
• What are effects of 3D geometry?
3D Ridge-Trench Interaction
Temperature isosurface ridge trench
Slab viscosity isosurfac e
3D Ridge-Trench Interaction
• Side view
• Front view
3D Ridge-Trench Interaction
• Slab sinking induces complex 3D flow & interaction with approaching ridge & small-scale instabilities.
Ex. 2: 3D Flow Models of Alaska
• Detailed regional model (2 km resolution).
• Slab shape constructed from seismic observations.
Geometry of 3D Flow at a Slab
Edge
• Corner-flow dominates away from slab edge.
• Slab is steepening (sinking back & down).
• Toroidal flow around slab edge (slab-parallel flow).
Decoupling of Plate & Mantle Flow
• Pacific plate motion matches observations.
– Speed and direction.
• Mantle flows at rates of up to 90 cm/yr.
– Slab-parallel component near slab edge ~ 10 cm/yr.
• Significant decoupling of mantle flow from plates.
Evidence For Fast Mantle Flow
• Costa Rica: tracking isotopic signature transport along arc.
– 6.5 - 19.0 cm/yr
– Sub. Rate: 8.5 cm/yr
Hoernle et al., Nature 2008.
• If slab-parallel component is fraction (10 %) of mantle flow, predicts mantle flow rates of >
65 cm/yr
ISA orientation, LPO & SKS Fast-
Axis
• ISA can be non-parallel to mantle flow
– wedge, slab edge. -- need B-type fabric in wedge nose.
• ISA match observations of SKS fast-axis orientations
(from Christensen & Abers, 2009).
ISA Sensitive to Rheology &
Geometry
• Need broad (strategic) distribution of observations
• Can distinguish successful models from unsuccessful
3D Geometry of ISA Orientation
• Highly variable orientations in the mantle wedge: shallow horizontal, dipping slab-parallel, middle dipping and...
Slab-parallel stretching
3D Geometry of ISA Orientations
• Need: Better calculation of LPO from flow (A,B...)
– 3D analysis of seismic anisotropy data & model results.
Conclusions
• Many opportunities to use dynamic modeling
– to integrate observations & test hypothesis,
– to help plan other experiments & observations.
• Need to create a strategy for development of better numerical methods for future MARGINS sceince.
– What tools do we need most now?
– How do we create these tool in tandem with collection & interpretation of data (field or laboratory-based)?
– How do we leverage work being done by CIG
(Computational Infrastructure for Geodynamics)?
