Blue Carbon in seagrass ecosystems
advertisement
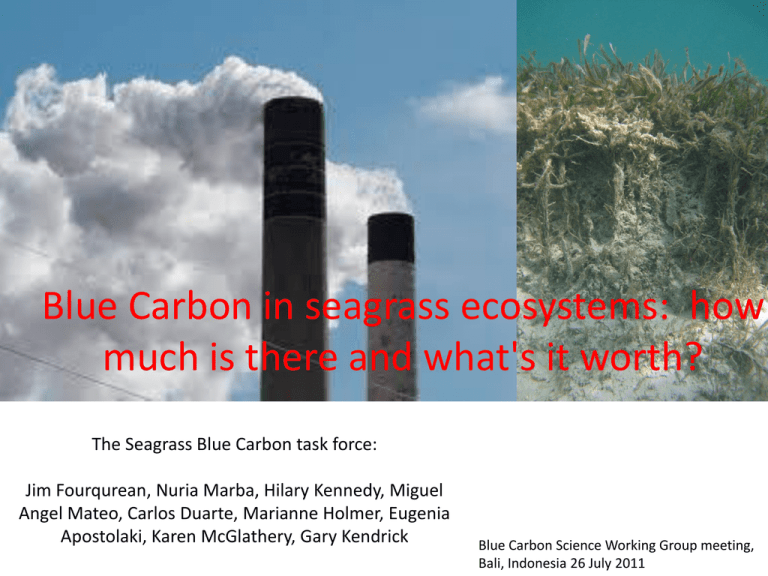
Blue Carbon in seagrass ecosystems: how much is there and what's it worth? The Seagrass Blue Carbon task force: Jim Fourqurean, Nuria Marba, Hilary Kennedy, Miguel Angel Mateo, Carlos Duarte, Marianne Holmer, Eugenia Apostolaki, Karen McGlathery, Gary Kendrick Blue Carbon Science Working Group meeting, Bali, Indonesia 26 July 2011 Seagrasses are flowering plants that live submerged in the sea Seagrasses have a broad global distribution Primary producers: tropical seagrass beds are among the most productive ecosystems, rivaling agricultural crops like corn and soybeans Sediment stabilizers: seagrasses efficiently hold sediments in place, preventing resuspension and movement of sediment deposits Nutrient processors: Seagrass beds absorb and transform nutrients in the marine environment Manatee (Trichechus) In Thalassia meadow, Puerto Rico R.P. van Dam J. Kenworthy Seagrass provides critical food source in tropical regions Green Sea Turtle (Chelonia) In Thalassia and Syringodium meadow, Yucatan, Mexico G. Pergent G. Kendrick Seagrass provides critical habitat in temperate and tropical regions Seahorse (Hippocampus) In Cymodocea meadow, Mediterranian Sea Zebra fish (Girella) In Posidonia meadow, Perth, Western Australia Seagrasses are valuable and threatened compared to other major marine habitats A new realization: seagrasses are important in the global carbon balance Dense seagrass beds fix more CO2 than they consume Duarte et al. 2010 GBC Estimates of global CO2 flux in seagrass beds low high estimate of estimate of global Integrated global NCP extent NCP extent Integrated NCP tons CO2e ha-1y-1 km2 Tg CO2e y-1 km2 Tg CO2e y-1 Mean 4.4 300000 130.7 600000 261.4 Upper 95th cl of mean 6.2 300000 185.5 600000 371.1 Lower 95th cl of mean 2.5 300000 75.9 600000 151.8 maximum 85.4 300000 739.2 600000 1478.3 For comparison, mean NCP for: wetlands = 0.6 tons CO2e ha-1y-1 Amazon rainforest: 3.7 tons CO2e ha-1y-1 At $20/ton, the NCP value of seagrasses is about $88 ha-1y-1, small compared to the $19k for nutrient processing or $3k of fisheries yield Duarte et al 2010 GBC But what about the value of the Blue Carbon stored in the system? 12 Carbon fixed in seagrass beds does not all stay in the seagrass beds 13 Only about half of the C buried in seagrass beds is derived from seagrass -5 -15 1:1 -20 13 Csediment (‰) -10 Y = -2.31 + 1.39x SE of slope = 0.08 r2 = 0.22, p<0.001 -25 -30 -22 -20 -18 -16 -14 -12 -10 -8 -6 -4 13 Cseagrass (‰) Kennedy et al 2010 GBC So, how much C is stored in seagrass ecosystems? • Measuring C storage in some Seagrass ecosystems: • Florida Bay • Shark Bay • Western Mediterranean • Literature review of C stores in seagrasses • Back-of-the-envelope estimates of the sizes of stocks and potential value of those stocks in a global CO2 market 15 Measuring C stored in living biomass 16 Measuring C stored in seagrass soils: Piston corer to collect uncompressed cores 17 18 Need: • volumetric measures of Dry Bulk Density (mass of soil per volume) • Carbon content of soil (as a fraction of mass) – Organic matter, or Loss on Ignition (LOI) – Corg 19 There are about 18,000 km2 of seagrass beds in south Florida Florida Bay is broken into many basins by mud banks that are often exposed at low tides. These mud banks restrict water circulation and tidal effects in the Bay The mud banks increase in thickness towards the southeast part of the Bay Trout Creek Russell Bank Bob Allen Keys Nine Mile Bank n= 695 mean = 0.84 ± 0.02 median = 0.83 minimum = 0.24 maximum = 1.63 Frequency 0.3 0.2 0.1 0.0 0.0 0.2 0.4 0.6 0.8 1.0 1.2 1.4 1.6 1.8 2.0 Dry Bulk Density (mg mL-1) Frequency 0.2 0.1 n= 695 mean = 6.28 ± 0.28 median = 5.60 minimum = 2.63 maximum = 43.78 0.3 Frequency n= 697 mean = 2.39 ± 0.15 median = 2.05 minimum = 0.64 maximum = 22.73 0.3 0.2 0.1 0.0 0.0 0 1 2 3 4 5 6 7 8 9 Corg (% of dry weight) 10 + 0 2 4 6 8 10 12 14 16 18 20 + LOI (%) 23 5 25 Corg (% of dry wt) Corg (% of dry wt) 6 20 15 • LOI vs Corg 4 10 5 0 3 0 10 20 30 40 Loss on Ignition (% of dry wt) 50 2 For LOI <= 10: Corg = -0.12 + 0.38(LOI) r2=0.79, p<0.001 1 For all data: Corg = -0.99 + 0.54(LOI) r2=0.95, p<0.001 0 0 2 4 6 8 Loss on Ignition (% of dry wt) 10 24 0 50 50 Depth (cm) Depth (cm) Corg generally decreases downcore in Florida Bay seagrass soils. 0 100 150 100 150 200 200 Bob Allen Keys 250 0 0 250 0 Buried peats have high Corg 1 2 3 0 6 5 4 Depth (cm) 100 150 1 2 3 4 5 6 Organic C content (% of dry wt) Organic C content (% of dry wt) 50 50 Depth (cm) Russel Bank 100 150 200 200 Nine Mile Bank Trout Cove 250 250 0 1 2 3 4 5 Organic C content (% of dry wt) 0 6 1 2 3 4 5 Organic C content (% of dry wt) 6 0 50 50 Depth (cm) Depth (cm) DBD generally increases downcore in Florida Bay seagrass soils. 0 100 150 200 100 150 200 Bob Allen Keys Russel Bank 250 0 250 0 0.0 0.2 0.4 0.6 0.8 1.0 1.2 1.4 1.6 0.0 0.2 0.4 0.6 0.8 1.0 1.2 1.4 1.6 Buried peats have low DBD -1 -1 Dry Bulk Density (g mL ) 50 Depth (cm) Depth (cm) 50 100 150 200 Dry Bulk Density (g mL ) 100 150 200 Nine Mile Bank Trout Cove 250 250 0.0 0.2 0.4 0.6 0.8 1.0 1.2 1.4 1.6 0.0 0.2 0.4 0.6 0.8 1.0 1.2 1.4 1.6 -1 Dry Bulk Density (g mL ) -1 Dry Bulk Density (g mL ) 26 Florida Bay soil C stocks (integrating over the top meter) Core ID kg CO2e m-2 tons CO2e ha-1 Bob Allen1 Bob Allen 2 Russell Bank 1 Russell Bank 2 Florida Bay estimates of OM stocks Nine Mile Bank 1 Nine Mile Bank 2 Trout Cove 1 Trout Cove 2 65.6 57.6 61.5 58.1 71.5 78.6 44.6 38.1 656 576 615 581 715 786 446 381 mean sd 95% CI 59.5 13.3 9.2 594.5 132.9 92.1 Estimate of seagrass biomass C: 4.4 – 18.3 tons CO2e ha-1 A very rough estimate of carbon stored in the top meter of seagrass soils in south Florida: 18,000 km2 of seagrasses 594 tons CO2e ha-1 1 x 10⁹ tons CO2e stored in the soils! Anthropogenic CO2e flux is about 29 x 109 tons y-1 http://www.sharkbay.org/seagrass.aspx 29 30 Florida Bay n= 695 mean = 0.84 ± 0.02 median = 0.83 minimum = 0.24 maximum = 1.63 0.3 Frequency Shark Bay 0.2 0.1 n= 247 mean = 0.75 ± 0.01 median = 0.72 minimum = 0.35 maximum = 1.18 0.3 0.2 0.1 0.0 0.0 0.2 0.4 0.6 0.8 1.0 1.2 1.4 1.6 1.8 2.0 0.0 0.0 0.2 0.4 0.6 0.8 1.0 1.2 1.4 1.6 1.8 2.0 Dry Bulk Density (mg mL-1) n= 695 mean = 6.28 ± 0.28 median = 5.60 minimum = 2.63 maximum = 43.78 0.3 Frequency Dry Bulk Density (mg mL-1) 0.2 0.1 n= 247 mean = 9.11 ± 0.20 median = 8.92 minimum = 2.77 maximum = 19.09 0.3 0.2 0.1 0.0 0.0 0 2 4 6 8 10 12 14 16 18 20 + 0 2 4 6 8 LOI (%) n= 697 mean = 2.39 ± 0.15 median = 2.05 minimum = 0.64 maximum = 22.73 Frequency 0.3 0.2 10 12 14 16 18 20 + LOI (%) 0.1 n= 222 mean = 3.31 ± 0.10 median = 3.33 minimum = 0.21 maximum = 8.87 0.3 0.2 0.1 0.0 0.0 0 1 2 3 4 5 6 7 8 9 Corg (% of dry weight) 10 + 0 1 2 3 4 5 6 7 8 9 Corg (% of dry weight) 10 + 31 • Soil properties vary in space across the study area 32 Little evidence of compaction down-core in Shark Bay 0 0 20 20 20 40 40 40 60 80 60 80 Depth (cm) 0 Depth (cm) Depth (cm) Southeastern sites Southwestern sites Northwestern sites 60 80 100 100 100 120 120 120 140 140 140 0.0 0.2 0.4 0.6 0.8 1.0 1.2 1.4 1.6 0.0 0.2 0.4 0.6 0.8 1.0 1.2 1.4 1.6 0.0 0.2 0.4 0.6 0.8 1.0 1.2 1.4 1.6 -1 -1 -1 Dry Bulk Density (g mL ) Dry Bulk Density (g mL ) Dry Bulk Density (g mL ) 33 Corg is constant or increases down-core in Shark Bay 0 0 20 20 20 40 40 40 60 80 Depth (cm) 0 Depth (cm) Depth (cm) Southeastern sites Southwestern sites Northwestern sites 60 80 60 80 100 100 100 120 120 120 140 140 140 0 2 4 6 Organic C content (% of dry wt) 80 2 4 6 Organic C content (% of dry wt) 8 0 2 4 6 8 Organic C content (% of dry wt) 34 Shark Bay relationship between LOI and Corg is similar to that found in Florida Bay Corg (% of dry wt) 6 5 Corg = 0.06 + 0.36(LOI) r2=0.68, p<0.001 4 3 2 1 0 0 2 4 6 8 10 12 14 Loss on Ignition (% of dry wt) 35 Shark Bay soil C stocks (integrating over the top meter) Core ID Northeastern sites W11-2 W12-2 Southwestern sites F17b 116 F10b Southeastern sites W4b 431 128 mean sd 95% CI kg CO2e m-2 tons CO2e ha-1 90.6 98.5 906 985 42.3 81.3 122.9 423 813 1229 108.4 86.3 77.6 1084 863 776 88.5 23.9 16.5 884.8 238.8 165.5 36 A very rough estimate of carbon stored in the top meter of seagrass soils in Shark Bay: 4,000 km2 of seagrasses 900 tons CO2e ha-1 0.4 x 10⁹ tons CO2e stored in the soils! 0 Depth (cm) 100 200 300 400 500 0 5 10 15 20 25 30 Organic C content (% of dry wt) 38 Western Mediterranean Posidonia soil C stocks (top meter) Core ID kg CO2e m-2 tons CO2e ha-1 Villajoyosa 139.4 1394.4 Villajoyosa 117.6 1176.3 Villajoyosa 114.5 1144.6 Tabarca 239.9 2398.6 Tabarca 84.6 846.2 Tabarca 304.0 3040.3 Tabarca 96.9 969.4 El Campello 246.2 2462.3 El Campello 115.6 1156.2 Portlligat 171.4 1714.1 Portlligat 96.6 966.1 Portlligat 190.0 1900.0 Portlligat 70.8 708.1 Portlligat 71.7 717.3 Culip 210.6 2106.0 Medes Island 166.1 1661.2 Posidonia biomass: 1.3-85.7 tons CO2e ha-1 33.4 +/- 3.2 (95% CI) Soil C stocks: 708.1- 3040.3 tons CO2e ha-1 1552.6 +/- 341.6 (95% CI) 39 A very rough estimate of carbon stored in the top meter of Posidonia oceanica soils in Western Mediterranean: 40,000 km2 of seagrasses 1553 tons CO2e ha-1 6.2 x 10⁹ tons CO2e stored in the soils Towards an estimate of global Seagrass Blue carbon stocks 3576 data points from 882 discrete sample locations 41 Number of observations 180 mean = 9.3 ± 2.1 median = 2.9 range: 0.01 - 85.7 160 140 120 100 80 60 40 20 0 0 10 20 30 40 50 60 70 80 90 100 Seagrass Biomass (tons CO2e ha-1) 42 Number of Observations 600 500 400 n=2549 mean = 1.03 ± 0.02 median = 0.92 range: 0.06 - 2.35 300 200 100 0 0.0 0.2 0.4 0.6 0.8 1.0 1.2 1.4 1.6 1.8 2.0 2.2 Soil Dry Bulk Density (g mL-1) 43 Number of Observations 800 n=2504 mean = 2.5 ± 0.1 median = 1.8 range: 0.0 - 48.2 600 400 DBD frequency 200 0 0 2 4 6 8 10 12 14 16 18 20 Soil Corg (% of dry wt) 44 B or T Tr em ea op pe l F o ic al rat res O Up e F t ce la or nd es Fl ani or c m Fo t id an res a Sh Ba gr t ov ar y se es k M Bay agr ed a ite sea ss gr rr a as G n e lo s ba an l s P. ea o. gr as s Ecosystem C storage -1 (tons CO2e ha ) 4000 3000 0 * 2000 Top meter of soil 1000 * * a a a b a. IPCC 2007 b. Donato et al 2011 45 Global averages carbon sequestration rates and global ranges for the main carbon pools, by habitat type Habitat Type Annual Carbon Sequestration Rate (tCO2e/ha/yr) Living biomass (tCO2e/ha) Soil organic carbon (tCO2e/ha) Seagrass 4.4 ± 0.95a 0.4–100b 66–3040c Tidal Marsh 7.97 ± 8.52d 12–60e 330–1,980f Estuarine Mangroves 6.32 ± 4.8g 237–563h 1,060h Oceanic Mangroves 6.32 ± 4.8g 237–563h 1,690–2,020h Reports of seagrass losses and the rates of decline are increasing dramatically Waycott et al. 2009 PNAS Seagrass ecosystems are declining globally Waycott et al. 2009 PNAS Pendelton et al. in review Points to remember: 1. Seagrasses play a significant part in the global C cycle 2. Shark Bay, Florida Bay and the Mediterranean have huge C stocks 3. Globally, seagrasses are as important as forests in storing CO2 (on an areal basis) 4. The value of the C stored in seagrasses is around $12,000 ha-1, on par with the annual value of other ecosystem services provided by seagrasses 5. Seagrasses are declining at a fast rate, potentially releasing 0.1 – 0.3 Gton CO2e y-1 (worth ca. $4-12 B y-1 at current market values) 6. Can seagrasses be included in a REDD+-like scheme? Who would get the payments? 7. Big job ahead: predicting the fate of stored C when seagrasses are destroyed 50


![[Company Name] Certificate of Completion](http://s2.studylib.net/store/data/005402466_1-8a11f4ced01fd5876feee99f8d8e6494-300x300.png)
