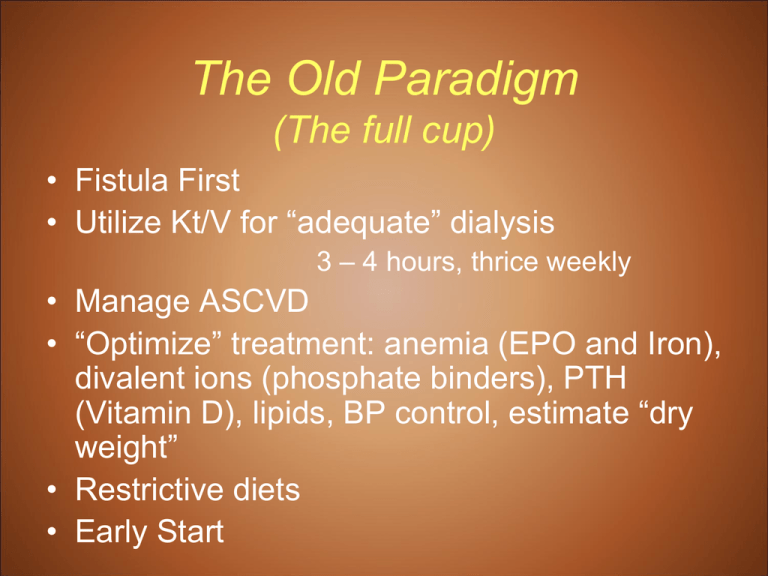
The Old Paradigm
(The full cup)
• Fistula First
• Utilize Kt/V for “adequate” dialysis
3 – 4 hours, thrice weekly
• Manage ASCVD
• “Optimize” treatment: anemia (EPO and Iron),
divalent ions (phosphate binders), PTH
(Vitamin D), lipids, BP control, estimate “dry
weight”
• Restrictive diets
• Early Start
The State of Renal Care in the U.S.
Challenges and Changes
“We can do better”
Dallas, Texas
June, 2010
The Boston Steering Committee
Conclusions
• The model of dialytic care since the 1970s is insufficient:
– the nephrology community likely used incomplete - perhaps even
flawed – science, at least as we know the science now
– the providers and payers supported the model
– for 35 years.
• The problem is propagated by how we measure ourselves:
– Clinical Performance Measures; (CPMs; CPGs; i.e., HGB, Kt/V, Ca, P,
…)
• Though enormously helpful, current CPMs do not provide the
power to predict the outcomes that we had hoped for, either for the
patient or the facility.
• Current CPMs account for only about 14% of the measurable
differences in facility outcomes (SMRs).
• Consequentially, too many patients are dying,
hospitalizations are too high, and cost is enormous.
• The Boston meeting concluded that now we have the
information to change this
To accomplish:
• The REASONS for the Boston Meeting
– Mortality trends
– Hospitalization trends
– Costs
• SUMMARY of Boston Meeting data,
conclusions and recommendations
• ACTIONS to implement change, since the
meeting
Mortality
Adjusted mortality rates in period prevalent
patients, by vintage & modality
Figure p.18 (Volume 2)
Dallas M and M Conference
Period prevalent dialysis patients; adjusted for age, gender, race, & primary diagnosis. Dialysis patients, 2005, used as
reference cohort.
USRDS 2009 ADR
Adjusted all-cause mortality in the first
year of hemodialysis, by month & age
Figure 1.2 (Volume 2)
Incident hemodialysis patients age 20 and older; followed from the day of onset of ESRD; adjusted for gender, race, &
primary diagnosis. Incident hemodialysis patients, 2005, used as reference.
USRDS 2009 ADR
The Boston meeting concluded that – now – we can do better than this.
Hospitalizations
Adjusted admissions
& days, by modality
Figure 6.3 (Volume 2)
Period prevalent ESRD patients; rates adjusted for age, gender, race, & primary diagnosis. ESRD patients, 2005, used
as reference cohort.
USRDS 2009 ADR
Adjusted cardiovascular admissions in the
first year of hemodialysis, by month & age
Figure 1.7 (Volume 2)
Incident hemodialysis patients age 20 and older; followed from the day of onset of ESRD; adjusted for gender, race, &
primary diagnosis. Incident hemodialysis patients alive at day 90 after initiation, 2005, used as reference.
USRDS 2009 ADR
The Boston meeting concluded that we can do something about this.
Adjusted admissions for infection in the first
year of hemodialysis, by month & age
Figure 1.8 (Volume 2)
Incident hemodialysis patients age 20 and older; followed from the day of onset of ESRD; adjusted for gender, race, &
primary diagnosis. Incident hemodialysis patients alive at day 90 after initiation, 2005, used as reference.
USRDS 2009 ADR
Once again, it was concluded that we can do something about this.
Costs
Total ESRD expenditures
Figure p.22 (Volume 2)
$34B if other
payors included
Period prevalent ESRD
patients. Includes
payments for MSP
patients, but no
estimate for HMO costs
or organ acquisition.
USRDS 2009 ADR
Per person per year total
Medicare ESRD expenditures
Figure p.23 (Volume 2)
Period prevalent ESRD
patients with Medicare
as primary payor &
not enrolled in
Medicare Advantage.
USRDS 2009 ADR
Our Current Milieu of Care
• 20% of facility patients die each year; 70% deceased in 5
years; Up to 40% mortality in the first year
• A program that costs $34+,000,000,000/year
• With a cost of $60 – 80,000 PPPY with the difference
based on AV access alone
• $20,000 PPPY in hospitalizations, mostly due to
cardiovascular disease and infection
• Less than 20% rehabilitation
• 110,996 new ESRD patients – 2007
– 101,688 In Center HD
– 6506 PD (6875 in 2005)
– 2665 Pre-emptive transplant (2424 in 2005)
Therapies and Outcomes
Results from an informal survey at 2008 ASN
• Possible Therapies
–
–
–
–
–
–
–
–
CAPD
CCPD
Conventional In Center
Nocturnal In Center
Conventional HHD
Nocturnal HHD
Short Daily HHD
Transplant
• Living
• Cadaveric
– Palliative
• Therapies Stratified by
Nephrologists’ Choice
– Transplantation
– Nocturnal HHD
– Nocturnal In-center and
Short Daily HHD
– Conventional HHD
– CAPD and CCPD
– Conventional In Center
– Palliative
98% would choose alternatives to
conventional care.
If we are going to choose
conventional therapy for patients,
then we need to do it better. Let’s
at least get it right.
To Accomplish This Morning
• The REASONS for the Boston Meeting
– Mortality
– Hospitalization trends and causes
– Costs
• A SUMMARY of Boston Meeting data,
conclusions and recommendations
• ACTION since the meeting
Primary Issues Identified
(4 days, >1700 PPT Slides)
•
•
•
•
•
Infection and AV Access
Cardiovascular Disease
Inflammation
The Dialysis Dose
The First Year
Preventive care for infectious
complications
•
•
•
•
•
The variation is vaccination rates for influenza and
pneumococcal pneumonia are considerable and
unexplained.
These vaccinations are very inexpensive compared to the
cost of a single hospitalization for pneumonia yet universal
adoption is lacking.
In fact, there has been no progress in influenza vaccination
rates for the last 5 years!
Pneumococcal pneumonia vaccinations have increase to a
greater degree in some providers!
Providers need to be held accountable for the lack of
performance is this area.
USRDS 2008 ADR
Vascular access use at initiation,
by gender, 2007
Figure p.10 (Volume 2)
82%
Incident hemodialysis
patients, 2007, with
new (revised edition)
Medical Evidence
forms.
USRDS 2009 ADR
Access use at first outpatient dialysis,
by primary diagnosis, 2007
Figure 3.1 (Volume 2)
Incident hemodialysis
patients, 2007.
USRDS 2009 ADR
Catheter Events and Hospitalizations
Catheter events
& complications
Figure 5.20 (Volume 2)
Fistula events and
complication are .2 to .4 as
prevalent
Prevalent hemodialysis
patients age 20 & older,
ESRD CPM data; only
includes patients who
are also in the USRDS
database. Year
represents the
prevalent year & the
year the CPM data
were collected. Access
is that listed as
“current” on the CPM
data collection form.
USRDS 2009 ADR
Consequences of Catheters
• 22% infectious complications, with septic
arthritis, endocarditis and osteomyelitis
• 43% higher cardiovascular related death rate
than fistulas in some studies
• AVF after 90 days with 29% reduction in allcause mortality compared to catheters
• Greater all cause and infection related
hospitalizations
• Reduced dialysis adequacy, poorer quality of life
and greater costs
Trends in CVD and Infectious
Hospitalization rates in the first month
Rate per 1,000 Pt Yrs
Adjusted for age, gender, race and cause of ESRD
Infectious hospitalizations now
approach CVD for the 1st time!
750
700
650
600
550
500
450
400
350
300
All CV 0<1
All Infect 0<1
All CV 1<2
All Infect 1<2
2005
2004
Incident Cohort Year
2003
2002
2001
2000
1999
1998
1997
1996
1995
1994
1993
USRDS 2008 ADR
Mortality Risk in Facilities that have
Greater Use of Catheters or AV Grafts versus low use
RR of death
Fac. Catheter Use
1.5
(R2=0.95)
1.45
1.31
1.26
1.24
1.25
1.14
1
1
1.07
1.38
Fac. Graft Use
(R2=0.966)
1.14
1
Quintiles for Graft
and Catheter Use
0.75
0.5
0
20
40
60
% Adjusted Facility Access Use
80
Infection Trends
• Infection hospitalizations substantially
increasing over past 10 years, largely due to
catheters
• Infection hospitalizations increasing at a rate
greater than cardiovascular hospitalizations
• Much higher costs in patients with catheters
• There is even likely a linkage between one
access infection and associated ongoing risk
of death
• Higher mortality in catheter patients and
facilities with more catheters (and grafts)
Boston Meeting Recommendations #1:
Infection and Access
• Acknowledge: The catheter problem is IATROGENIC
• Hospitals, health plans, nephrologists, providers and
vascular surgeons (currently, 50% primary failure
rate) must be accountable for reducing catheter
placement
• CMS might consider moving catheters, as a CPM, to
the very highest level of scrutiny and surveys and
place less emphasis on CPMs that make little
difference in outcomes
– They just concluded a TEP to make just such
recommendations, which are now being considered
• Vaccination, as a CPM, needs to be an important
aspect of facility practice and accountability
Primary Issues
•
•
•
•
•
Infection and AV Access
Cardiovascular Disease
Inflammation
The Dialysis Dose
The First Year
ASCVD is apparently not the leading
cause of CV death, and all of these years
we’ve concentrated on hemoglobin, calcium,
phosphorus, lipids and the like – to fix the
cardiovascular problem.
We’ve simply been looking at the wrong
outcomes measures to improve mortality,
hospitalizations and cost associated with CV
disease.
It’s LVH and Cardiomyopathy
%
LVH
glassock
THEME:
Alterations in LV Mass in
CKD/ESRD are an Example of
What is WRONG with
Conventional Regimens of
Treatment
The Core Issues: LV Disease
• LV mass disease progresses as CKD
progresses (not inevitably)
• Increased LV Mass is very prevalent in the
incident ESRD patient (70%), with only
minimal to modest improvement with
conventional in-center HD (A bit better
with PD)
• Non regressors have a very poor
prognosis
Glassock
Three of every four deaths and
hospitalizations in dialysis
patients can be linked to
sudden death or CHF
Left Ventricular in Origin
Glassock
Myocardial changes in patients
with renal failure
normal morphology
morphology of the myocardium of a patient
with chronic renal failure
Ritz
Cardiac fibrosis –
most powerful predictor of survival in HD patients
(endomyocardial biopsies)
dilated
cardiomyopathy
idiopathic
< 30%
fibrosis
area
hemodialysis
> 30%
Aoki, Kidn.Internat.(2005) 67:333
Ritz
Leading Causes of LV Muscle
and Fibrotic Disease
• Hypervolemia
– “dry weight” is an “evil doer”
– Whatever happened to euvolemia or
normalized extracellular volume?
• Hypertension
• Inflammation (likely caused by
hypervolemia)
• Cardiac stunning during overly aggressive
ultrafiltration because of shortened dialysis
Volume Overload and LVH
• In experimental spontaneous
hypertension, LV Mass increase is linked
to volume expansion and salt intake, not
to blood pressure
• Salt-loading may increase LV mass
through local effects (augmentation of AII effects and TGFβ)
(Varagic J. et al Am J Physiol Heart Circ Physiol 290:Hi503, 2006; Wu
HCM, et al Circulation 98:2621, 1998))
Consequences of LVH and
cardiac fibrosis
• CHF
– Difficulty attaining euvolemia with short Rx time
– Because of ongoing hypervolemia, it is the leading
cause of hospitalizations and death, especially in the
first year, but ongoing.
– High cause of re-hospitalization
• Arrhythmias
– Fibrous tissue encircling myocytes with high electrical
resistance; local delay of the spreading front of the
action potential
• Favors “re-entry” type of atrial and ventricular ARRYTHMIAS
with high hospitalization and death
LVH and Dialysis mode and
Prescription
• Conventional 3x/wk dialysis corrects
less than 40% of LVH
• Observational (cross-sectional) studies
show a lower prevalence of LVH in PD
compared to conventional HD patients
• Emerging data: More frequent/longer HD
sessions: strongly associated with a
much lower prevalence, even reversal
of LVH compared to conventional HD
(Awaiting FHN studies)
• It is very difficult to attain euvolemia with
the current model of care
What has not worked so far
in conventional hemodialysis to
resolve cardiovascular disease?
• Statins have not been effective
– 4D and Aurora
• ESA treatment of anemia has not had a salutary
effect on mortality
• Attempting to attain euvolemia with conventional
HD
• Traditional outcome assessments oriented towards
ASCVD
• Sodium modeling and control
LVH in ESRD:
Effect of EPO therapy
• Seven (7) RCT have been conducted
that examine the effect of EPO
therapy on LVH in CKD/ESRD
• All but one have failed to show any
beneficial effect on LVH of EPO
therapy and correction of hemoglobin
to normal or near normal levels
Harmful Effect of Dialysis
(after McIntyre CW, et al CJASN, 4:914,2009)
• Myocardial “Stunning” (transient regional
wall motion abnormality) develops
frequently (65%) during hemodialysis,
especially in presence of underlying CHD
and/or Diabetes
• High UF volumes increase risk
• Repeated episodes compromise cardiac
function, lead to LV fibrosis and enhance
mortality risk
Sodium
• Known effects on blood pressure and
hypervolemia (inter-dialytic weight gains)
• Blood pressure independent target organ
damage
– Vasculature changes
– Minor increases of sodium in CSF or serum increases
pressor mechanisms and increases cardiotonic
steroids – sodium modeling
• And we load our patients with sodium
–
–
–
–
Hypertonic Saline bolus for hypotension
Saline bolus in the rinse back (hypertonic) and priming
Sodium modeling
Dialysate sodium (hypertonic to usual serum sodium)
A New Paradigm
Adding control of LVH to Clinical
Performance Guidelines will achieve
salutary effects on morbidity and
mortality in ESRD therapy
Cardiovascular Disease in ESRD:
Boston Conclusions
•
•
•
•
•
This is a problem of the left ventricle, not ASCVD
It is a problem of hypervolemia
The new paradigm of ESRD therapy must include
modification of LVH as a high priority
Current “conventional” HD regimen is insufficient to
fully correct or substantially modify LVH by lowering
extracellular volume, BP and correcting fibrosis
(despite “adequate” Kt/V), in the majority of patients
Longer/more frequent HD regimens with shorter interdialytic intervals very likely improve LVH (and thereby
reduce hospitalizations and mortality due to CHF and
arrhythmias) - FHN will provide the definitive answer
Boston Meeting Recommendations #2:
Cardiovascular (LV) Disease
• Forego misapplication of the formulaic (Kt/V) approach to
“adequate” dialysis
• Greater emphasis on LV disease with Td tied to attainment
of normalized ECV (not “dry weight). Td and volume
become the new CPMs.
• Caution about sodium modeling until safety studies affirm
benefit
• (Did not recommend more frequent or hugely longer
therapies. Though tying therapy to volume removal will
likely result in somewhat longer therapies.)
• CMS to work with nephrology community in development of
objective measures for assessment of volume status that
would result in decreased hospitalization costs induced by
volume/CHF/LVH/arrhythmias
– They just concluded a TEP to do just that
Primary Issues
•
•
•
•
•
Infection and AV Access
Cardiovascular Disease
Inflammation
The Dialysis Dose
The First Year
Reversing “InflammationInduced” Malnutrition
• Dietary counseling, in the traditional
manner, has minimal effect
• Dietary supplements have mixed effect
• IDPN does not have sustainable effect
• More frequent and/or longer therapy has
the greatest effect in reversing the
problem
Boston Meeting Recommendations #3:
Inflammation
• No infection from catheters
• Abandon the “renal diet” as a universal
approach to nutritional counseling, except Na
• Attain normovolemia
• Feed patients, even nutritional supplements, and
then give them more than conventional dialysis
to remove K, P, etc. (The “renal diet” seems to have served
the renal community, rather than the patient, by allowing the patient
to look biochemically intact, while we give inadequate dialysis.)
• So, no catheters, more food and more dialysis
• (Note the emerging same story)
Primary Issues
•
•
•
•
•
Infection and AV Access
Cardiovascular Disease
Inflammation
The Dialysis Dose
The First Year
The Dialysis Dose
• The history and methodologies about our current
dosing are flawed and not supported by current
science
• It was a model developed over 30 years ago,
propagated by nephrologists, the payment
system and dialysis providers
• And no longer sustainable
• Too many patients are going into the hospital,
are dying, with the associated high costs
• The misapplication of Kt/V is highly detrimental
Hazard Ratios by Kt & BSA With Interaction
80
70
Incorrect to Assume
Kt = 0 + {Kt/V} x V
60
Kt
50
40
30
Curve
Linear, 0 Intercept
20
10
16.6 x Deterioration
0
0
1
2
3
4
BSA
xD
ete
rio
rat
i
2.2
1.4
1.5
1.6
1.7
1.8
1.9
2.0
2.1
65
75
1.2
1.3
Kt (l/Rx)
55
45
35
25
on
BSA (M 2)
And this totally ignores volume removal
Hazard Ratio
7.5
10
9
8
7
6
5
4
3
2
1
0
Lowrie
Effect of Other Therapies
Td and Interval
Alan Kliger
Daily (Suri et al)
Outcomes
# of Studies
SBP or MAP
Decrease
10 of 11
P or Binder Dose
No Change
6 of 8
Anemia
Improvement
7 of 11
Albumin
Increase
5 of 10
QOL
Improvement
5 of 10
LV Mass
Improvement
Culleton
SBP or MAP
Decrease
4 of 4
HBP Medications
Decrease
4 of 4
Anemia
Improvement
3 of 3
QOL
Improvement
Variable
Nocturnal (Walch)
The Four Major Problems with Kt/V
• In and of itself, it may not be “bad”. It is simply not
enough
• Does not acknowledge the differences in therapies
required for size of the individual
• Does not acknowledge the disproportionate value
of TD (duration of treatment time per week)
• Does not account for the fact that most dialysis
patients, using conventional Kt/V, are not
euvolemic, but indeed are volume overloaded
Boston Meeting Recommendations #4:
Dialysis Prescription
• Kt/V is not the “Holy Grail” and has enormous
shortcomings
• Time on dialysis needs to become a CPM, tied to:
–
–
–
–
LV disease
Euvolemia, not “dry weight”
blood pressure
inter-dialytic weight gain
• Work with CMS to develop CPMs acknowledging
this with the goal to fix CV disease
– They have just concluded a TEP to address this very
issue
Primary Issues
•
•
•
•
•
Infection and AV Access
Cardiovascular Disease
Inflammation
The Dialysis Dose
The First Year
All-cause & cause-specific mortality
in the first months of ESRD
Figure 1.1 (Volume 2)
incident dialysis
patients, 1993–1998 &
1999–2005 combined,
adjusted for age,
gender, race, &
primary diagnosis.
Incident dialysis
patients, 2005, used as
reference.
USRDS 2008 ADR
Percent change in hospital
admissions from day 1: 1993 to 2005
percent change in admission rates from
1993 to 2005
Incident hemodialysis patients age 65 and older
all-cause
230
210
190
cardiovascular
infection
vascular access infection
170
150
130
110
90
70
50
30
10
-10
0-<1
1-<2
2-<3
3-<6
6-<9
9-<12
months after dialysis initiation
USRDS 2008 ADR
*Model based adjustment for age, sex, race, cause of ESRD:
Interval Poisson regression (ASN 2008 poster)
Survival Curve, 1st 365 Days
Adjusted Cox-proportional
Survival Function forhazards
patterns 1 - 2regression model
Adjusted by age,
race,
Control gender,
RightStart
diabetes
group_number
1.00
Cum Survival
0.95
RightStart®
0.90
Control
0.85
P<0.001 by Cox Logrank, Breslow, and
Tarone-Ware tests
at 90, 180, and 365
day exposure levels.
0.80
0
100
200
300
400
risk_days_365
Hakim
Hospital Days per Patient Yr at Risk
RightStart
RightStart
Hospital Days/Pt Yr at Risk
20
20
Control
Control
18.5
18.5
18.3
18.3
17
17
15
15
13.4
13.4
14.5
14.5
13.3
13.3
10
10
55
00
Mo
Mo 1-3
1-3
Mo
Mo 1-6
1-6
Mo
Mo 1-12
1-12
Hakim
Boston Meeting Recommendations #5:
Incident Patients
• They need more intensive care, by the
nephrologist and dialysis provider, and
directed at those co-morbid processes that
cause the greatest mortality,
hospitalizations, re-hospitalizations and
costs: catheters and infection, volume
overload, wound care, malnutrition...
Primary Issues
•
•
•
•
•
Infection and AV Access
Cardiovascular Disease
Inflammation
The Dialysis Dose
The First Year
Dialysis:
The Old Paradigms
•
•
•
•
Fistula First
Optimize kT/V
Manage Coronary Heart Disease
“Optimal” treatment: anemia (EPO and Iron),
divalent ions (phosphate binders), PTH
(Vitamin D), lipids, BP medications, albumin
• Restrictive diets
• Early Start
Dialysis:
The New Paradigm
• Catheter last
• Volume control first, minding the
left ventricle
• More dialysis with emphasis on time
• Emphasis on the incident patient
• Eat, eat, eat (but not salt)
Conclusions for this Network 14
Meeting
After 1711 slides and 4 days in Boston
• The Boston Meeting is not suggesting that
we discard existing CPMs. CPMs and
CPGs are a rigorous and thoughtful
process.
• The emphasis on traditional CPMs needs to
be changed and new CPMs need to be
added.
• And that we be held more accountable for
better outcomes
Specific Conclusions for this RPA
Meeting:
After 1711 slides and 4 days in Boston
• Cease to spend so much time on weaker clinical
outcomes measurements that may only account
for 14% of the morbidity and mortality difference.
Change the CPMs
• Save the left ventricle and gain optimal control of
volume. Change the CPMs
• Do not tolerate catheters or those who place
them. Change the CPMs
• Intensify the care of the incident patients. Do not
be satisfied with a formulaic approach to
conventional dialysis. Change the CPMs
• (Partially treat inflammation with more protein and
caloric intake and time on dialysis)
I’m asking that, when you leave
here today, that you:
• Challenge your prior perceptions of adequate
dialysis, time on dialysis and euvolemia and
implement change.
– Patients should attain normal ECV the first of the
week. If not, schedule more time or an extra
treatment that week.
• Abandon all catheters > 90 days in incident
patients
• Intensify care of incident patients
• Feed your patients more protein, then give them
sufficient dialysis
To accomplish:
• An very brief overview of current ESRD
data
– Mortality
– Hospitalization trends and causes
– Costs
• A SUMMARY of Boston Meeting data,
conclusions and recommendations
• ACTION since the meeting and in the
future
Action Since Boston Meeting
•
•
•
•
•
•
•
•
•
•
•
Letter to CMS and White House
Meeting with CMS, November – 2009 and follow-up calls
CJASN Supplement, December – 2009
Articles in NNI and RenalWeb
ASN 2009 – 2 hour session
RPA 2010
ANNA 2010
Numerous Medical Schools and other venues
ASN 2010
Recent CMS Technical Expert Panel Mtg: March 10-11
Upcoming studies
CMS and Volume
• Held a meeting in Baltimore, 3-2010, a
Technical Expert Panel to address the volume
component of adequacy of dialysis
• Recommendations
– All patients start at 4 hours
– Greater sodium control
• No sodium modeling
• Lower dialysate sodium concentration
– Required clinical assessment of volume
– Home BP monitoring
– Pending: objective measurement
Recent CMS Regulation and
Reporting Change
• New data reporting for adequacy, infection
and vascular access beginning July 1, 2010
– Purpose: To develop “quality incentive payment
for dialysis providers” by January 1, 2012
• Indicators
– Kt/V
– Access infection
– Type of access
The world is changing.
The old ways will not do.
It’s time…
John Kennedy

