Document
advertisement
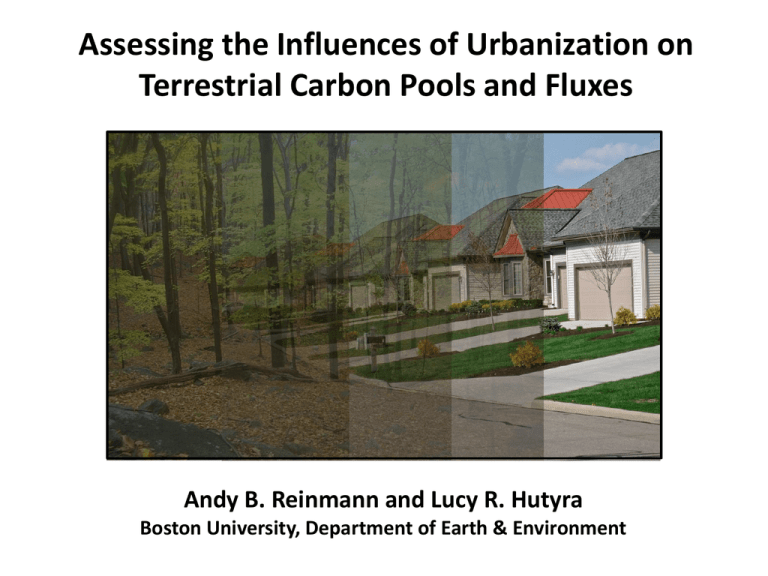
Assessing the Influences of Urbanization on Terrestrial Carbon Pools and Fluxes Andy B. Reinmann and Lucy R. Hutyra Boston University, Department of Earth & Environment View of the Terrestrial Carbon Cycle Carbon cycle research has centered on quantifying and understanding the controls on the terrestrial carbon sink in undeveloped landscapes View of the Terrestrial Carbon Cycle • Global urban expansion occurring at twice the rate of population growth • Tripling of urban land cover from 2000-2030 • Developed land covers ~6% of contiguous U.S. land area • Twice the extent of northern hardwood forest • Doubling of urban extent from 2000-2030 • Urbanization is new face of land cover change Seto et al. 2012 ; Nickerson et al. 2011 Projecting Land Cover Change from Urbanization ICLUS EPA Integrated Climate and Land Use Scenarios (ICLUS) Projects housing development • 1 ha resolution across U.S. • 13 housing density categories • 5 population growth scenarios Bierwagen et al. 2010 Projecting Land Cover Change from Urbanization ICLUS NLCD • Combine ICLUS with National Land Cover Database (NLCD) products • Composition of each housing density category • Proportions used to infer land cover change from ICLUS projections Projecting Changes in Carbon Storage and Fluxes • USFS Forest Inventory and Analysis • Forest growth curves • Forest biomass • Harvesting patterns • Biomass removed from harvesting and development divided into 9 carbon turnover pools • Published urban biomass values (Raciti et al. 2012) Massachusetts-Specific Parameters Forest Agriculture Water Urban/Developed Other 0.2 0.4 0.6 0.8 1.0 • Approach is an empirically informed, bookkeeping and scenario analysis • NOT a process-based model 0.0 Proportion TotalArea Area Proportion of Total • Forest and Urban are most common land cover types • Inversely related 1 2 3 4 5 6 7 8 9 10 11 12 13 99 Housing Density Category Housing Density Category 90 Historical Changes in MA Forest Cover 80 Reforestation 70 60 50 40 Agricultural Expansion FIA (Historical) 30 MA % Forested Urban Expansion 1600 1675 1750 1825 Year 1900 1975 2050 90 Projected Changes in MA Forest Cover 70 60 50 40 FIA (Historical) B1 (Low) BC (Baseline) A2 (High) 30 MA % Forested • 2010-2050 (projected) • 0.07 to 0.27% yr-1 decline 80 • 1971-2010 (observed) • 0.22% yr-1 decline 1600 1675 1750 1825 Year 1900 1975 2050 7 6 5 4 3 1950 2000 2050 40 50 60 hist.pop[, 3] FIA (Historical) B1 (Low) BC (Baseline) A2 (High) Population (Historical) 1600 1675 1750 1825 Year US Census; UN Population Division Population (millions) FALSE 70 1900 30 • MA pop. growth rate is 0.31% yr-1 • US mean is 0.97% yr-1 • Global mean is 1.29% yr-1 MA % Forested • 2010-2050 (projected) • 0.07 to 0.27% yr-1 decline 80 • 1971-2010 (observed) • 0.22% yr-1 decline 8 90 Projected Changes in MA Forest Cover 1900 1975 2050 Projected Spatial Distribution of Forest Cover 2010 Forest Cover Boston 20-30% 60-70% 40-50% 70-80% 50-60% 80-90% • Forest cover decreases west to east (Inverse of population patterns) B1 (Low Pop. Growth) 2010-50 • Lowest forest losses in most rural counties, losses increase from west to east Forest Loss <10% 20-30% 10-20% 30-40% A2 (High Pop. Growth) 2010-50 Forest Loss <10% 20-30% 10-20% 30-40% Changes in Spatial Distribution of Forest Cover 2010 to 2050 Conserved/Undevelopable Stable > 50% Forest Cover Stable Urban > 25% Loss of Forest Cover Uptake by veg. Loss to atmosphere 0.5 0.0 A2 (High) -0.5 Essex Berkshire MA Essex Berkshire MA • Land conversion reduces forest C sink by up to 28% B1 (Low) -1.0 • A2 (High pop. growth) • Land conversion becomes net source in rapidly urbanizing counties Development/Harvesting Forest Biomass Accrual Urban Biomass Accrual (only expansion) C Flux (MgC ha-1yr-1) • B1 (Low pop. growth) • Forest carbon sink offsets emissions from land conversion 1.0 Terrestrial Carbon Fluxes 2010 to 2050 Terrestrial Carbon Fluxes 2010 to 2050 40 30 20 Steet Trees Urban patch PreUrban 10 BAI (cm2 yr-1) 50 Urban growing conditions in aggregate favor vegetation growth (at least in MA) Briber et al. (in review) ? ? ? ? Essex MA Essex Berkshire Berkshire ? ? Uptake by veg. Loss to atmosphere 0.5 A2 (High) 0.0 B1 (Low) MA • Importance increases with urbanization Development/Harvesting Forest Biomass Accrual Urban Biomass Accrual (only expansion) Urban Biomass Accrual (expansion and 2x growth rate) -0.5 • Potential to offset reductions in C storage from forest loss -1.0 • Urban biomass accrual up to 75% of terrestrial C sink in rapidly developing landscapes C Flux (MgC ha-1yr-1) 1.0 Terrestrial Carbon Fluxes 2010 to 2050 25 Terrestrial Carbon Fluxes 2010 to 2050 15 A2 (High) Loss to atmosphere 10 Essex Berkshire MA Essex Berkshire MA • MA terrestrial carbon sink projected to offset 10 to 12% of fossil fuel emissions B1 (Low) 5 • Rural emissions offset by terrestrial carbon sink Fossil Fuels Development/Harvesting Forest Biomass Accrual Urban Biomass Accrual (only expansion) Urban Biomass Accrual (expansion and 2x growth rate) 0 • Emissions from land cover change < 2% of total emissions C Flux (MgC ha-1yr-1) 20 • Assuming constant per capita rate of emissions See Gately et al. poster on fossil fuel emissions Summary Urbanization has a profound affect on the terrestrial C cycle • Rapid decline in MA forest cover; urban biomass can comprise a large proportion of the terrestrial C sink • Terrestrial C sink will offset emissions associated with urbanization, but will be less than 12% of MA fossil fuel emissions • Most of our future urban area does not yet exist, we can actively shape the patterns in C fluxes through development choices • Urban biosphere fluxes also vital for atmospheric inversions and GHG verification Ongoing & Future directions • Process-based modeling (e.g., Hardiman et al. poster) • Albedo and latent heat flux • Quantify uncertainty • Export to other states (Gradient of land cover types and urbanization trajectories) Acknowledgements Funding Sources: Special Thanks to: Britt Briber, Tori Dearborn, Conor Gately, Jackie Getson, Brady Hardiman


