Staged Vs Continuous Representation
advertisement
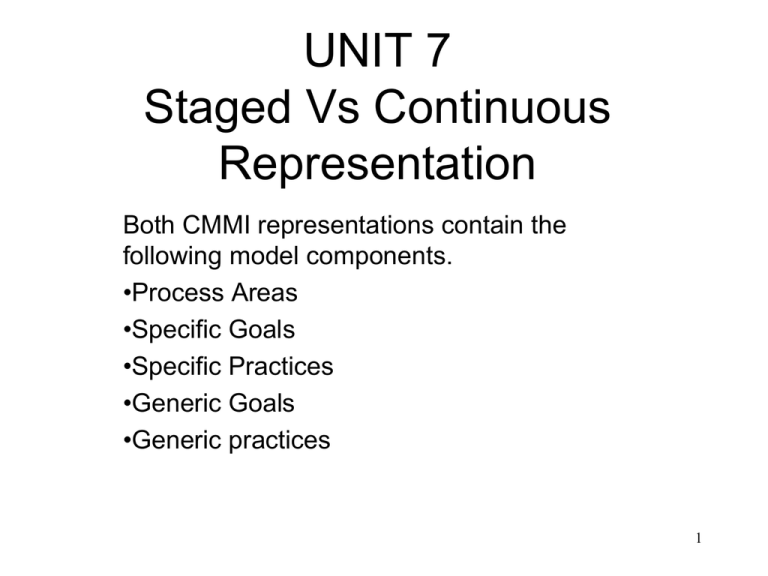
UNIT 7 Staged Vs Continuous Representation Both CMMI representations contain the following model components. •Process Areas •Specific Goals •Specific Practices •Generic Goals •Generic practices 1 CMMI Model Representations Process improvement can be approached from either the perspective of • organisational maturity (pertains to a set of process areas) • process area capability (pertains to a set of practices that map to a single process area) Further, there is an equivalence between the approaches so that process area capability can be equated to organisational maturity. 2 CMMI Process Areas – Staged Maturity Level 5 (Optimising) Representation Organisational Performance Management Causal Analysis & Resolution Maturity Level 4 (Quantitatively Managed) Maturity Level 3 (Defined) Maturity Level 2 (Managed) Requirements Management Project Planning Project Monitoring & Control Measurement & Analysis Configuration Management Process & Product QA Supplier Agreement Management Organisational Process Performance Quantitative Project Management Requirements Development Technical Solution Product Integration Verification Validation Organisational Process Focus Organisational Process Definition Organisational Training Integrated Project Management Risk Management Integrated Teaming Integrated Supplier Management Decision Analysis & Resolution Organisational Environment for Integration 3 Staged Representation Provides a single rating of the maturity of an organisation’s processes Permits comparisons between organisations by the use of maturity levels In order for an organisation to be at a particular level of maturity it must have satisfied the goals of all the process areas associated with that level of maturity and all of the goals of the processes associated with any lesser levels of maturity. 4 Continuous Representation Enables comparisons across and among organisations on a process area by process area basis. It is a process area which receives a capability rating. An organisation might have a number of process areas at different levels of capability 5 • Process area capability pertains to a set of practices relating to a single process area. • Organisational maturity pertains to a set of process areas across an organisation. Staged – Maturity assigned to the project or organisation ML5 ML4 ML3 Continuous –Capability assigned to a single process area or a set of process areas 2.5 2 1.5 1 ML2 PA1 PA2 PA5 PA19 PA12 0.5 Initial: Failed to be at ML2 0 6 Maturity levels provide a recommended order for approaching software process improvement. Maturity levels organise the process areas (each maturity level consists of a predefined set of process areas). Each maturity level stabilizes an important part of an organisation’s processes. The maturity levels are measured by the achievement of the specific and generic goals that apply to each predefined set of process areas. 7 Maturity Levels Optimizing Quantitatively Managed Defined Managed Initial: Failed to be at ML2 8 Maturity Level Characteristics Failing to be at ML2 Processes are chaotic. Success is largely dependent on the effort and skill of individuals (not on processes) who act as a driving force in the organisation. Projects often exceed budget and schedule. Such an organisation can produce products and services that work but this is despite the lack of processes not because of them. Tendency to over commit, abandon processes and not be able to repeat previous success. 9 Maturity Level Characteristics Maturity Level 2: Managed An organisation has achieved all specific and generic goals of the group of maturity level 2 process areas. Projects now manage their requirements and ensure that processes are planned, performed, measured and controlled. The status of projects is now visible to management at defined points. Stakeholders are involved and committed. Success can be repeated because there is now a reliance on process as opposed to people. 10 Maturity Level Characteristics Maturity Level 3: Defined An organisation has achieved all specific and generic goals of the group of maturity level 3 and level 2 process areas. Processes are well characterised and understood and described in standards and procedures. The organisation has established standard processes for consistency across the organisation and these can be tailored by projects in order to create ‘defined’ processes. 11 Maturity Level Characteristics Maturity Level 4: Quantitatively Managed An organisation has achieved all specific and generic goals of the group of maturity level 4, level 3 and level 2 process areas. Crucial subprocesses (which contribute greatly to overall process performance) are controlled using statistical and other quantitative techniques. Quantitative objectives can therefore be set for these subprocesses. Special causes of process variation can be identified and corrected to prevent future occurrence. Process performance is understood in statistical terms 12 and managed accordingly. Maturity Level Characteristics Maturity Level 5: Optimizing An organisation has achieved all specific and generic goals of the group of maturity level 5, level 4, level 3 and level 2 process areas. Processes are continually improved based on a quantitative understanding of common causes of variation. Improvement is brought about by both incremental and innovative technological means. Specific quantitative process improvement objectives for standard and defined processes are established and revised to reflect changing business objectives. These are used to gauge the success of any deployed improvement 13 Distinctions At ML4 special causes of processes variation areaddressed. At ML 5 it is common causes which are of concern. ML 4 processes may produce predictable results without meeting objectives. ML 5 the mean of process performance is moved in an attempt to meet objectives. The process is planned, performance is managed Optimizing Quantitatively Managed Defined Managed Initial Not a CMMI Maturity level The predictability of Process performance is quantitative at ML4 but only qualitative at ML3 The scope of application of the process descriptions, standards and procedures. At ML2 the procedures might be different in each instance of a process (in different projects) but at ML3 a projects procedures are tailored from standard organisation wide processes and are more detailed. 14 The staged model and the continuous model have generic practices in common. However, the staged model utilizes only those practices from GG2 and GG3. It does not utilize any practice of GG1. How then are ML4 and ML5 possible? 15 Equivalent Staging Equivalent staging allows a maturity level in the staged representation to be awarded from the designated capability of process areas in the continuous representation. 16 CL1 Requirements Management Measurement & Analysis Project Monitoring and Control Project Planning Process & Product Quality Assurance Supplier Agreement Management Configuration Management Decision Analysis & Resolution Product Integration Requirements Development Technical Solution Validation Verification Organisational Process Definition Organisational Process Focus Integrated Project Management Organisational Training Risk Management REQM MA PMC PP PPQA SAM CM DAR PI RD TS VAL VER OPD OPF IPM OT RSKM CL3 CL4 CL5 ML2 ML2 ML2 ML2 ML2 ML2 ML2 ML3 ML3 ML3 ML3 ML3 ML3 ML3 ML3 ML3 ML3 ML3 Organisational Process Performance OPP Quantitative Project Management QPM ML4 ML4 Organisational Performance Man. Causal Analysis and Resolution ML5 ML5 OPM CAR CL2 17 Interpretation of the diagram The coloured areas in the CL columns indicate target profiles that are equivalent to maturity levels in the staged representation • To be equivalent to maturity level 2 in a staged representation, the process areas to the left of green sector must have satisfied capability levels 1 and 2 in the continuous representation • To be equivalent to maturity level 3 in a staged representation, the process areas to the left of green and blue sector must have satisfied capability levels 1, 2 and 3 in the continuous representation 18 Maturity Level 2 Equivalence Staged Maturity Levels Optimizing The process areas of the staged maturity level 2 must be located in the continuous model and they must be evaluated to be at CL2 2 1.8 Quantitatively Managed 1.6 1.4 1.2 Defined 1 0.8 Managed 0.6 0.4 REQM MA PMC PP PPQA SAM CM 0.2 Initial 0 19 Interpretation of the diagram The coloured areas in the CL columns indicate target profiles that are equivalent to maturity levels in the staged representation • To be equivalent to maturity level 4 in a staged representation, the process areas to the left of green, blue and red sector must have satisfied capability levels 1, 2 and 3 in the continuous representation • To be equivalent to maturity level 5 in a staged representation, all of the process areas must have satisfied capability levels 1, 2 and 3 in the continuous representation 20 Q&A Q. Why are ML4 and ML5 present in the Staged Representation but CL4 and CL5 are absent from the Continuous Representation? • It is the execution of OPP and QPM and their selective application to other process areas that brings about quantitative management. • It is the execution of CAR and OPM and their selective application to other process areas that brings about optimisation. • If CL4 and CL5 existed in the Continuous Representation (as they did in v1.2 of the model) it would imply that any and every process area could be quantitively managed and optimised. Since these concepts should only ever be selectively applied to other process areas, CL4 and CL5 have been removed in V1.3 of the model. This does not mean that the concepts of quantitative management and optimisation have disappeared. The execution of OPP, QPM, CAR and OPM will in effect bring about the same effect. • Consequently process areas in the staged representation and now the continuous representation can only be assessed up to Generic Goal 3. The higher level concepts of quantitative management and optimisation are present only through execution of OPP, QPM, CAR and OPM. 21 Table: Comparison of Capability and Maturity Levels Level Continuous Representation Capability Levels Staged Representation Maturity Levels Level 0 Incomplete Level 1 Performed Initial Level 2 Managed Managed Level 3 Defined Defined Level 4 Quantitatively Managed Level 5 Optimizing 22 Target & Achievement Profiles DAR PP OPD PPQA VAL VER CM Capability Level 1 Capability Level 2 Capability Level 3 23
