Effect of Paper Color on Students` Physics Exam
advertisement
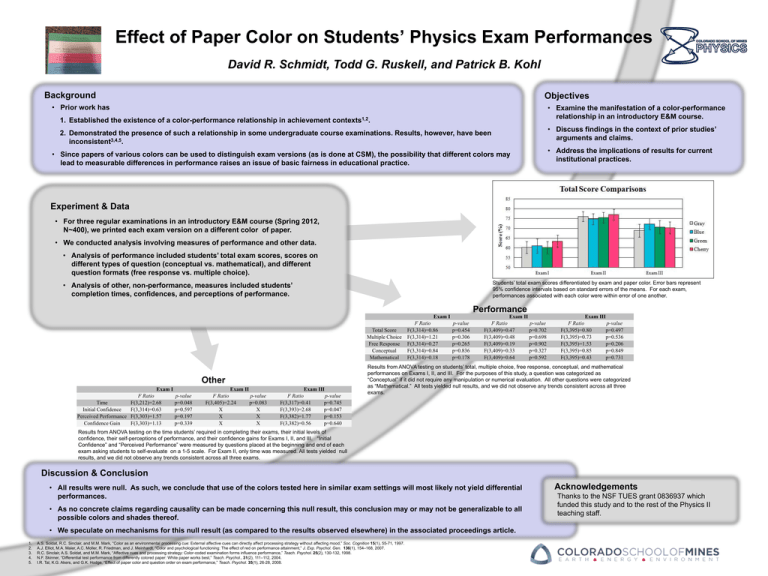
Effect of Paper Color on Students’ Physics Exam Performances David R. Schmidt, Todd G. Ruskell, and Patrick B. Kohl Background Objectives • Prior work has • Examine the manifestation of a color-performance relationship in an introductory E&M course. 1. Established the existence of a color-performance relationship in achievement contexts1,2. • Discuss findings in the context of prior studies’ arguments and claims. 2. Demonstrated the presence of such a relationship in some undergraduate course examinations. Results, however, have been inconsistent3,4,5. • Address the implications of results for current institutional practices. • Since papers of various colors can be used to distinguish exam versions (as is done at CSM), the possibility that different colors may lead to measurable differences in performance raises an issue of basic fairness in educational practice. Experiment & Data • For three regular examinations in an introductory E&M course (Spring 2012, N~400), we printed each exam version on a different color of paper. • We conducted analysis involving measures of performance and other data. • Analysis of performance included students’ total exam scores, scores on different types of question (conceptual vs. mathematical), and different question formats (free response vs. multiple choice). Students’ total exam scores differentiated by exam and paper color. Error bars represent 95% confidence intervals based on standard errors of the means. For each exam, performances associated with each color were within error of one another. • Analysis of other, non-performance, measures included students’ completion times, confidences, and perceptions of performance. Performance Exam I Total Score Multiple Choice Free Response Conceptual Mathematical Other Exam I F Ratio Time F(3,212)=2.68 Initial Confidence F(3,314)=0.63 Perceived Performance F(3,303)=1.57 Confidence Gain F(3,303)=1.13 Exam II p-value p=0.048 p=0.597 p=0.197 p=0.339 F Ratio F(3,405)=2.24 X X X Exam III p-value p=0.083 X X X F Ratio F(3,317)=0.41 F(3,393)=2.68 F(3,382)=1.77 F(3,382)=0.56 p-value p=0.745 p=0.047 p=0.153 p=0.640 F Ratio F(3,314)=0.86 F(3,314)=1.21 F(3,314)=0.27 F(3,314)=0.84 F(3,314)=0.18 Exam II p-value p=0.454 p=0.306 p=0.265 p=0.836 p=0.178 F Ratio F(3,409)=0.47 F(3,409)=0.48 F(3,409)=0.19 F(3,409)=0.33 F(3,409)=0.64 Exam III p-value p=0.702 p=0.698 p=0.902 p=0.327 p=0.592 F Ratio F(3,395)=0.80 F(3,395)=0.73 F(3,395)=1.53 F(3,395)=0.85 F(3,395)=0.43 p-value p=0.497 p=0.536 p=0.206 p=0.849 p=0.731 Results from ANOVA testing on students’ total, multiple choice, free response, conceptual, and mathematical performances on Exams I, II, and III. For the purposes of this study, a question was categorized as “Conceptual” if it did not require any manipulation or numerical evaluation. All other questions were categorized as “Mathematical.” All tests yielded null results, and we did not observe any trends consistent across all three exams. Results from ANOVA testing on the time students’ required in completing their exams, their initial levels of confidence, their self-perceptions of performance, and their confidence gains for Exams I, II, and III. “Initial Confidence” and “Perceived Performance” were measured by questions placed at the beginning and end of each exam asking students to self-evaluate on a 1-5 scale. For Exam II, only time was measured. All tests yielded null results, and we did not observe any trends consistent across all three exams. Discussion & Conclusion • All results were null. As such, we conclude that use of the colors tested here in similar exam settings will most likely not yield differential performances. • As no concrete claims regarding causality can be made concerning this null result, this conclusion may or may not be generalizable to all possible colors and shades thereof. • We speculate on mechanisms for this null result (as compared to the results observed elsewhere) in the associated proceedings article. 1. 2. 3. 4. 5. A.S. Soldat, R.C. Sinclair, and M.M. Mark, “Color as an environmental processing cue: External affective cues can directly affect processing strategy without affecting mood,” Soc. Cognition 15(1), 55-71, 1997. A.J. Elliot, M.A. Maier, A.C. Moller, R. Friedman, and J. Meinhardt, “Color and psychological functioning: The effect of red on performance attainment,” J. Exp. Psychol. Gen. 136(1), 154–168, 2007. R.C. Sinclair, A.S. Soldat, and M.M. Mark, “Affective cues and processing strategy: Color-coded examination forms influence performance,” Teach. Psychol. 25(2), 130-132, 1998. N.F. Skinner, “Differential test performance from differently colored paper: White paper works best,” Teach. Psychol., 31(2), 111–112, 2004. I.R. Tal, K.G. Akers, and G.K. Hodge, “Effect of paper color and question order on exam performance,” Teach. Psychol. 35(1), 26-28, 2008. Acknowledgements Thanks to the NSF TUES grant 0836937 which funded this study and to the rest of the Physics II teaching staff.

