Nigeria - in-depth country presentation and discussion
advertisement
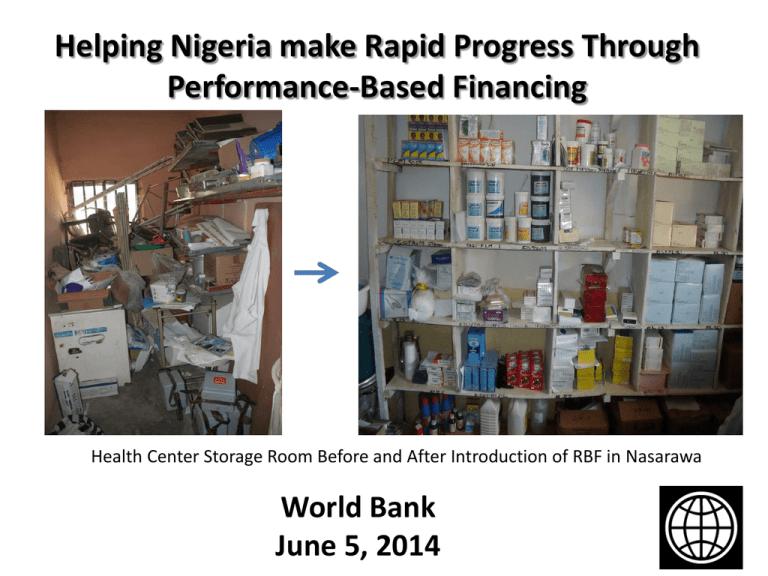
Helping Nigeria make Rapid Progress Through Performance-Based Financing Health Center Storage Room Before and After Introduction of RBF in Nasarawa World Bank June 5, 2014 1 Outline 1. Background on the Health Sector in Nigeria 2. How Performance-Based Financing works in Nigeria 3. How is PBF being supported in Nigeria 2 1. Background: IMR & U5MR from NDHS 2003-2013 250 200 201 157 150 128 125 100 100 99.3 75 IMR U5MR MDG4 Target 73.9 69 50 0 2003 2008 2013 3 Total Fertility Rate – NDHS: Very Slow Progress 6 6 5.7 5.7 1990 2003 2008 5.5 5 4 3 2 1 0 2013 4 Child Nutritional Status 2003-13: No Progress 45 40 42 41 37 35 29 30 24 25 23 2008 18 20 2013 14 15 2003 11 10 5 0 Stunting Source: NDHS 2003, 2008, 2013 Wasting Weight for Age 5 Service Delivery 2003-13 in Rural Nigeria: Little Progress, Poor Coverage 100 ANC=Antenatal Care, SBA=Skilled Birth Attendance, CPR=Contraceptive Prevalence Rate 90 80 70 60 50 50.6 ANC 46.4 46.5 40 30 20 10 0 27.1 SBA 27.7 22.7 27 DPT3 CPR 24.9 12.8 5.7 6.5 5.7 2003 2008 2013 Source: NDHS 2003, 2008, 2013 6 Geographical Inequities in DPT3 Coverage: NDHS 2003-2013 100 90 80 70 North Central 60 North East 50 North West 40 South East 30 South South South West 20 10 0 2003 2008 2013 7 Quality of Care is Problematic – Initial Results of Service Delivery Indicators (SDI) Survey • Nearly 30% health worker absenteeism • Most health workers do NOT have the knowledge needed to treat important diseases • Average public facility sees 1.5 patients/day • Essential drugs are mostly NOT available • No correlation between drug supply & patient load • Nigeria compares poorly to other countries where SDI has been carried out in Africa 8 What has NOT worked - “Simple” solutions X Shortage of Health Workers: Ratio of doctors & nurses to population twice the SSA average X Shortage of drugs: Yes a huge problem but no correlation between drug supply & patient volume X Lack of Physical Infrastructure: 67% of population lives within 30 minutes walk of health facility, 85% within 60 minutes X Absolute lack of public investment: Could be higher but bigger issues are efficiency and allocation of resources 9 No Correlation between Expenditure & ANC Coverage ANC Coverage % 100 90 80 70 60 50 40 30 20 10 0 0.0 500.0 1000.0 1500.0 2000.0 2500.0 Per Capita Health Expenditure by State (Naira) 3000.0 Source: World Bank Analysis from State PEMFAR/PER/PEFA Reports and NDHS 2008 10 2. Experience with Performance Based Financing (PBF) - Example Service Number Provided Last Quarter Unit Price Child fully vaccinated Skilled birth attendance Curative care patient visit Sub-Total Remoteness (Equity) Bonus Quality bonus 50 60 1,800 $2 $10 $0.5 Total Earned $100 $600 $900 $1,600 +25% $2,000 Score (50%) x 25% of volume $200 Total $2,200 Use of Funds Drugs and consumables Outreach expenditures Repairs & maintenance of health facility Bonuses to staff in the facility Savings $500 $250 $150 $1,100 $200 11 Example of a Quantitative Checklist to determine Quality of Care Score May Date of Visit Availability of Drugs (0-10) 7 Presence of staff (0-10) 5 HMIS implementation (0-10) 3 Village health committee (0-10) 5 Cleanliness of Health Center 6 Quality of delivery care (0-10) 6 Outreach activities (0-10) 2 TOTAL SCORE (out of 70) 34 TOTAL PERCENT 49 Aug. Nov. 7 6 3 8 7 7 5 43 61 8 8 5 9 8 7 6 51 73 Feb. 10 9 5 10 10 8 8 60 86 12 3. Results across 3 pre-pilot LGAs OPD per capita 0.90 Payment Delays Adamawa Nasarawa Ondo Institutional Delivery Payment Delays 60% 0.80 50% 0.70 0.60 40% 0.50 30% 0.40 0.30 20% 0.20 10% 0.10 0.00 0% 12 2 4 6 8 10 12 2 4 6 8 10 12 12 2 4 6 8 10 12 2 4 6 8 10 12 Assumption: Estimated crude birth rate (per 1000 pop): Adamawa (51), Nasarawa (38), Ondo (32) 13 Indicators dependent on outside inputs are more risky Completely Vaccinated Child 100% 90% 80% New users of modern FP methods 40% Variable due to issues in cold chain Adamawa Nasarawa Ondo 35% Impressive results to be verified with baseline data 30% 70% 25% 60% 50% 20% 40% 15% 30% 10% 20% 5% 10% 0% 0% 12 2 4 6 8 10 12 2 4 6 8 10 12 12 2 4 6 8 10 12 2 4 6 8 10 12 Assumption: Estimated crude birth rate (per 1000 pop): Adamawa (51), Nasarawa (38), Ondo (32) 14 Quality scores are converging at high level but still have variations across states Adamawa Nasarawa Ondo Quality Score (%) 100 90 80 81 70 69 66 65 60 30 20 83 41 83 87 86 85 76 67 64 70 65 66 68 67 67 57 52 51 % 50 40 84 45 26 21 10 Q4 '11 Q1 '12 Q2 '12 Q3 '12 Q4 '12 Q1 '13 Q2 '13 Q3 '13 Q4 '13 15 Traditional Financing $ Inputs HF is a black box Theory of Change - Why we think PBF works! Is the FOCUS •Worker incentives •Management autonomy •Improved Governance • Focus on Quality •Operating budget • Cash $ •Clear signals of priorities • Systematic Supervision • Verified Data- Stronger M&E Outputs 16 4. How is PBF Being Supported in Nigeria? • 3 states are participating in Nigeria State Health Investment Project (NSHIP), Adamawa, Nasarawa, Ondo. • 5 year project/program of $150M IDA + $20M HRITF • Pre-Pilot started in 2011 in 3 LGAs • Being scaled up, now nearly 18 LGAs involved • Baseline surveys for Impact Evaluation completed. Will give more indication of success of pre-pilot • Substantial interest from other states. 17
