Revenue Statistics 2014 - Italy
advertisement

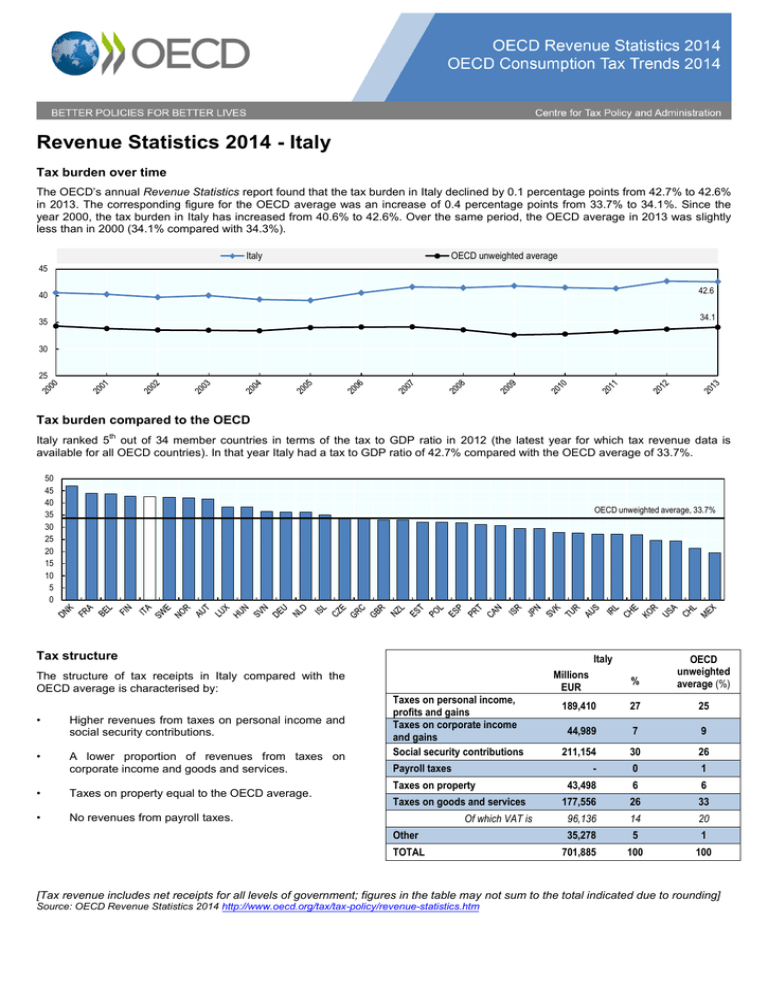
Revenue Statistics 2014 - Italy Tax burden over time The OECD’s annual Revenue Statistics report found that the tax burden in Italy declined by 0.1 percentage points from 42.7% to 42.6% in 2013. The corresponding figure for the OECD average was an increase of 0.4 percentage points from 33.7% to 34.1%. Since the year 2000, the tax burden in Italy has increased from 40.6% to 42.6%. Over the same period, the OECD average in 2013 was slightly less than in 2000 (34.1% compared with 34.3%). Italy OECD unweighted average 45 42.6 40 34.1 35 30 25 Tax burden compared to the OECD th Italy ranked 5 out of 34 member countries in terms of the tax to GDP ratio in 2012 (the latest year for which tax revenue data is available for all OECD countries). In that year Italy had a tax to GDP ratio of 42.7% compared with the OECD average of 33.7%. 50 45 40 35 30 25 20 15 10 5 0 OECD unweighted average, 33.7% Tax structure The structure of tax receipts in Italy compared with the OECD average is characterised by: • Higher revenues from taxes on personal income and social security contributions. • A lower proportion of revenues from taxes on corporate income and goods and services. • Taxes on property equal to the OECD average. • No revenues from payroll taxes. Italy % OECD unweighted average (%) 189,410 27 25 44,989 7 9 211,154 30 26 - 0 1 Millions EUR Taxes on personal income, profits and gains Taxes on corporate income and gains Social security contributions Payroll taxes Taxes on property Taxes on goods and services Of which VAT is 43,498 6 6 177,556 26 33 96,136 14 20 Other 35,278 5 1 TOTAL 701,885 100 100 [Tax revenue includes net receipts for all levels of government; figures in the table may not sum to the total indicated due to rounding] Source: OECD Revenue Statistics 2014 http://www.oecd.org/tax/tax-policy/revenue-statistics.htm Consumption Tax Trends 2014 - Italy VAT share of total tax revenues The OECD’s biennial Consumption Tax Trends report found that VAT revenues in Italy accounted for 13.8% of total tax revenue in 2012, below the OECD average of 19.5%. VAT rates The Italian standard VAT rate is 22%, which is above the OECD average. The average VAT/GST standard rate in the OECD was 19.1% on 1 January 2014, up from 17.6% on 1 January 2009. Reduced VAT rates of 4% and 10% apply to a number of goods and services. In the last five years, 20 of the 34 OECD countries have raised their standard VAT/GST rate at least once. In line with this trend, Italy increased its standard VAT rate from 20% to 21% in 2011 and to 22% in 2012. The reduced rates have remained unchanged. 30 25 20 OECD unweighted average, 19.1% 15 10 5 0 VAT Revenue Ratio The VAT Revenue Ratio (VRR) for Italy was 0.38 in 2012, one of the lowest in the OECD and well below the OECD average of 0.55. The VRR is a measure of the revenue raising performance of a VAT system. A ratio of 1 would reflect a VAT system that applies a single VAT rate to a comprehensive base of all expenditure on goods and services consumed in an economy - with perfect enforcement of the tax. As in many OECD countries, this ratio fell in Italy in 2008 and 2009 coinciding with the advent of th e global economic crisis. After a temporary increase in 2010-2011, Italy’s VRR dropped again in 2012. Italy OECD unweighted average 0.65 0.60 0.55 0.55 0.50 0.45 0.40 0.35 0.38 0.30 [VAT: value added tax. GST: goods and services tax] Source: OECD Consumption Tax Trends 2014 http://www.oecd.org/tax/consumption/consumption-tax-trends-19990979.htm Contacts David Bradbury Centre for Tax Policy and Administration Head, Tax Policy and Statistics Division David.Bradbury@oecd.org OECD Revenue Statistics Maurice Nettley Centre for Tax Policy and Administration Head, Tax Data & Statistical Publications Maurice.Nettley@oecd.org OECD Consumption Tax Trends Stéphane Buydens Centre for Tax Policy and Administration VAT Policy Advisor Stephane.Buydens@oecd.org


