3/27/2014
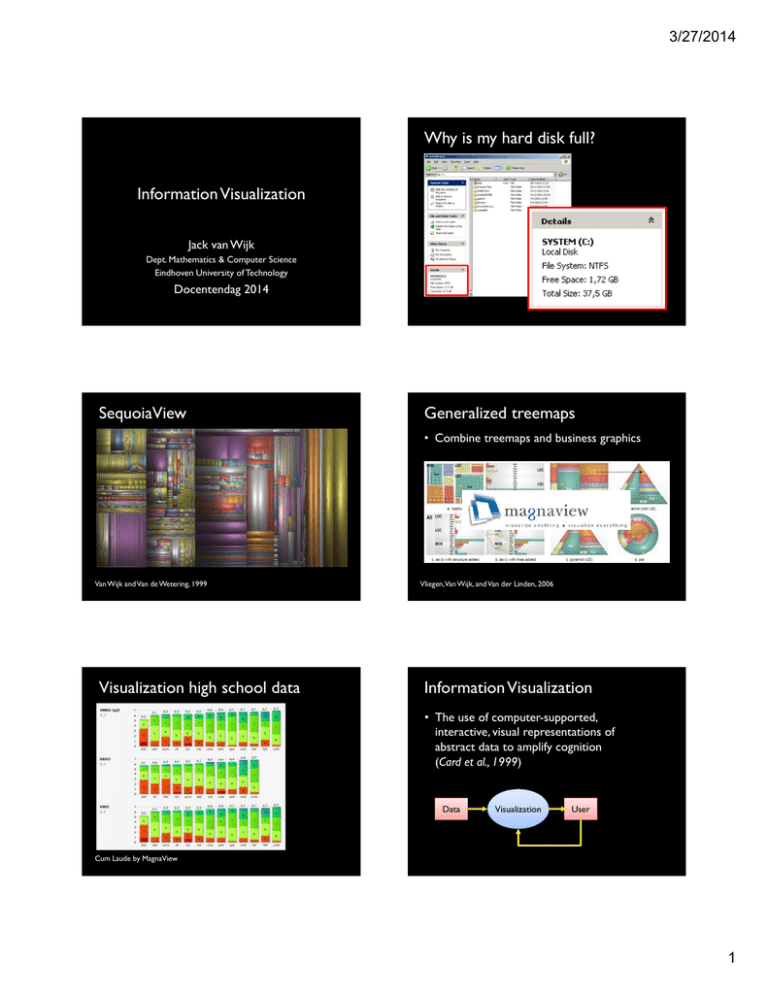
Why is my hard disk full?
Information Visualization
Jack van Wijk
Dept. Mathematics & Computer Science
Eindhoven University of Technology
Docentendag 2014
SequoiaView
Generalized treemaps
• Combine treemaps and business graphics
Van Wijk and Van de Wetering, 1999
Visualization high school data
Vliegen,Van Wijk, and Van der Linden, 2006
Information Visualization
• The use of computer-supported,
interactive, visual representations of
abstract data to amplify cognition
(Card et al., 1999)
Data
Visualization
User
Cum Laude by MagnaView
1
3/27/2014
Information Visualization
Abstract data: main types
• The use of computer-supported,
interactive, visual representations of
abstract data to amplify cognition
(Card et al., 1999)
Data
Visualization
Multivariate visualization:
scatterplot
Tree visualization:
tree diagram
User
Graph visualization:
node link diagram
Data types
Items with attributes
multivariate data
time series data
networks
hierarchical data
images
text
name
video
simple
age
hard
length
• Vary in complexity
• One data set, many interpretations
• Example
sex
Multivariate data: tables
Distribution per attribute
name
age
length
sex
n
Simone
54
1.68
F
2
Jack
54
1.85
M
Merel
26
1.72
F
Ivo
24
1.95
M
1
0
1.60
1.80
2.00 length
2
3/27/2014
Multivariate data: Parallel Coordinates Plot
Events
50
1950
1960
1970
1980
1990
2000
Multivariate data: scatterplot
10
age
2.00
F
1.50
M
length
sex
Sets
senior
age
50
F
M
young
10
1.50
2.00 length
Hierarchy
Network
senior
s
y
same sex
similar age
young
3
3/27/2014
One data set, many interpretations
Abstract data: main types
Multivariate visualization:
scatterplot
Tree visualization:
tree diagram
Graph visualization:
node link diagram
Abstract data: main types
Multivariate visualization:
scatterplot
Challenge:
What if we have
Tree visualization:
huge amounts of
tree diagram
data?
Graph visualization:
node link diagram
Anscombe’s quartet
Data size
business graphics
small (1-10)
infovis
medium (1000)
visual analytics
huge (> 106)
Try to move to the left:
• Filter, aggregate, statistics, machine learning, …
without loosing essential information
Analysis of time-series data
• Given: 10 minute measurements for one year
• 52,560 measurements
• How to visualize these?
Francis Anscombe, 1973
4
3/27/2014
Analysis of time-series data
Van Wijk and Selow, 1999
Telecom data Ivory Coast
Information Visualization
• The use of computer-supported,
interactive, visual representations of
abstract data to amplify cognition.
(Card et al., 1999)
Data
Visualization
User
Van den Elzen, 2013
Infographics vs InfoVis
Infographics:
- Static
- Explanation
- Made by data journalist
- Viewed
Vi
d by
b lay
l audience
di
Kentico.com
Infographics vs InfoVis
Infographics:
- Static vs interactive
- Explanation vs
explorative
- Made by data journalist
vs domain expert
- Viewed by lay audience
vs domain expert
Kentico.com
5
3/27/2014
Information Visualization
The human visual system
• The use of computer-supported,
interactive, visual representations of
abstract data to amplify cognition
• ((Card et al., 1999))
Data
Visualization
User
http://eofdreams.com
The human visual system
http://vinceantonucci.com
Translating data into pictures…?
Perception of symbols
• How many red objects?
Position, width, height, colors encode six variables…
6
3/27/2014
Perception of symbols
• How many red objects?
Perception of symbols
• How many circles?
Perception of symbols
• How many blue circles?
Perception of symbols
• How many circles?
Perception of symbols
• How many blue circles?
Limits to perception of symbols
• Combinations of attributes cannot be
perceived pre-attentively
7
3/27/2014
Color for encoding information
Adelson checkerboard illusion
• Translate data into colors
• The human as light meter?
www.weerdirect.nl
Adelson checkerboard illusion
Use ColorBrewer for palettes
Cynthia Brewer: http://colorbrewer2.org
Size matters
Size matters
Maureen Stone: In Color Perception, Size Matters, CG&A 2012
Maureen Stone: In Color Perception, Size Matters, CG&A 2012
8
3/27/2014
Vary luminance
Showing directions in edges
arrow
green-to-red
light-to-dark
light
to dark
dark-to-light
dark
to light
curved
tapering
Maureen Stone: In Color Perception, Size Matters, CG&A 2012
Holten and Van Wijk, 2009
Result of experiments
Information Visualization
• The use of computer-supported,
interactive, visual representations of
abstract data to amplify cognition
• ((Card et al., 1999))
Data
Visualization
User
Holten and Van Wijk, 2009
Visualization of vessel traffic
Willems et al., 2009
Visualization of vessel traffic
Willems et al., 2009
9
3/27/2014
SequoiaView
Van Wijk and Van de Wetering, 1999
Botanically
TreeView inspired treevis
Kleiberg,Van de Wetering, van Wijk, 2001
Abstract data: often a mix
Multivariate visualization:
scatterplot
Botanically inspired treevis
Kleiberg,Van de Wetering, van Wijk, 2001
Trees+networks+multivariate data
• Everywhere!
Tree visualization:
tree diagram
Graph visualization:
node link diagram
10
3/27/2014
Hierarchical edge bundles
Holten, 2006
Information Visualization
Spin-off: SynerScope
• The use of computer-supported,
interactive, visual representations of
abstract data to amplify cognition
(Card et al., 1999)
• www.synerscope.com
• Transaction analysis, fraud detection
Data
Visualization
User
Information Visualization
• The use of computer-supported,
interactive, visual representations of
abstract data to amplify cognition
(Card et al., 1999)
Data
Visualization
Thank you!
User
11

