Stephen George - Poster - Texas Tech University Departments
advertisement
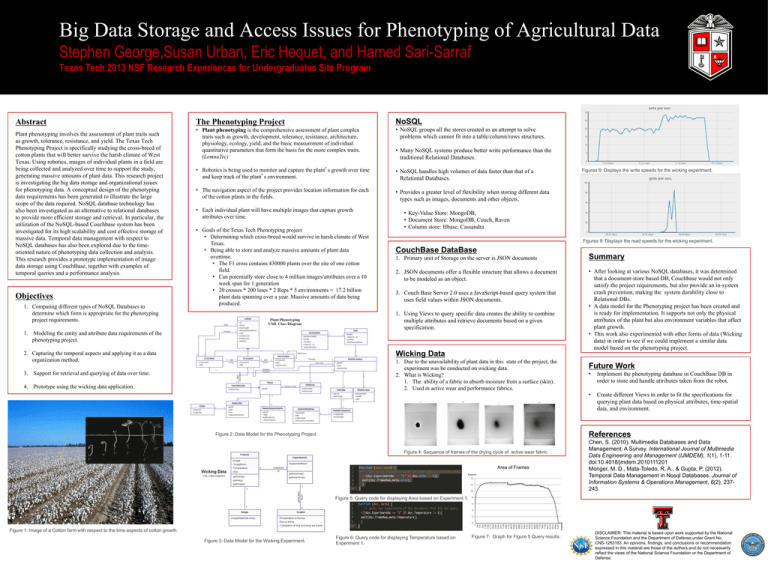
Big Data Storage and Access Issues for Phenotyping of Agricultural Data Stephen George,Susan Urban, Eric Hequet, and Hamed Sari-Sarraf Texas Tech 2013 NSF Research Experiences for Undergraduates Site Program Abstract Plant phenotyping involves the assessment of plant traits such as growth, tolerance, resistance, and yield. The Texas Tech Phenotyping Project is specifically studying the cross-breed of cotton plants that will better survive the harsh climate of West Texas. Using robotics, images of individual plants in a field are being collected and analyzed over time to support the study, generating massive amounts of plant data. This research project is investigating the big data storage and organizational issues for phenotyping data. A conceptual design of the phenotyping data requirements has been generated to illustrate the large scope of the data required. NoSQL database technology has also been investigated as an alternative to relational databases to provide more efficient storage and retrieval. In particular, the utilization of the NoSQL-based Couchbase system has been investigated for its high scalability and cost effective storage of massive data. Temporal data management with respect to NoSQL databases has also been explored due to the timeoriented nature of phenotyping data collection and analysis. This research provides a prototype implementation of image data storage using CouchBase, together with examples of temporal queries and a performance analysis. Objectives 1. Comparing different types of NoSQL Databases to determine which form is appropriate for the phenotyping project requirements. The Phenotyping Project NoSQL • Plant phenotyping is the comprehensive assessment of plant complex traits such as growth, development, tolerance, resistance, architecture, physiology, ecology, yield, and the basic measurement of individual quantitative parameters that form the basis for the more complex traits. (LemnaTec) • NoSQL groups all the stores created as an attempt to solve problems which cannot fit into a table/column/rows structures. • Many NoSQL systems produce better write performance than the traditional Relational Databases. • Robotics is being used to monitor and capture the plant’s growth over time and keep track of the plant’s environment. • NoSQL handles high volumes of data faster than that of a Relational Databases. • The navigation aspect of the project provides location information for each of the cotton plants in the fields. • Provides a greater level of flexibility when storing different data types such as images, documents and other objects. • Each individual plant will have multiple images that capture growth attributes over time. • Goals of the Texas Tech Phenotyping project • Determining which cross-breed would survive in harsh climate of West Texas. • Being able to store and analyze massive amounts of plant data overtime. • The F1 cross contains 430000 plants over the site of one cotton field. • Can potentially store close to 4 million images/attributes over a 10 week span for 1 generation • 20 crosses * 200 lines * 2 Reps * 5 environments = 17.2 billion plant data spanning over a year. Massive amounts of data being produced. • Key-Value Store: MongoDB, • Document Store: MongoDB, Couch, Raven • Column store: Hbase, Cassandra Figures 9: Displays the read speeds for the wicking experiment. CouchBase DataBase 1. Primary unit of Storage on the server is JSON documents Summary 2. JSON documents offer a flexible structure that allows a document to be modeled as an object. • After looking at various NoSQL databases, it was determined that a document-store based DB, Couchbase would not only satisfy the project requirements, but also provide an in-system crash prevention, making the system durability close to Relational DBs. • A data model for the Phenotyping project has been created and is ready for implementation. It supports not only the physical attributes of the plant but also environment variables that affect plant growth. • This work also experimented with other forms of data (Wicking data) in order to see if we could implement a similar data model based on the phenotyping project. 3. Couch Base Server 2.0 uses a JavaScript-based query system that uses field values within JSON documents. 1. Using Views to query specific data creates the ability to combine multiple attributes and retrieve documents based on a given specification. 1. Modeling the entity and attribute data requirements of the phenotyping project. Wicking Data 2. Capturing the temporal aspects and applying it as a data organization method. 1. Due to the unavailability of plant data in this state of the project, the experiment was be conducted on wicking data. 2. What is Wicking? 1. The ability of a fabric to absorb moisture from a surface (skin). 2. Used in active wear and performance fabrics. 3. Support for retrieval and querying of data over time. 4. Prototype using the wicking data application. Figures 8: Displays the write speeds for the wicking experiment. Future Work • Implement the phenotyping database in CouchBase DB in order to store and handle attributes taken from the robot. • Create different Views in order to fit the specifications for querying plant data based on physical attributes, time-spatial data, and environment. References Figure 2: Data Model for the Phenotyping Project. Figure 4: Sequence of frames of the drying cycle of active wear fabric. Area of Frames Area/cm 14 12 10 Figure 5: Query code for displaying Area based on Experiment 1. Chen, S. (2010). Multimedia Databases and Data Management: A Survey. International Journal of Multimedia Data Engineering and Management (IJMDEM), 1(1), 1-11. doi:10.4018/jmdem.2010111201 Monger, M. D., Mata-Toledo, R. A., & Gupta, P. (2012). Temporal Data Management in Nosql Databases. Journal of Information Systems & Operations Management, 6(2), 237243. 8 6 4 2 1 288 575 862 1149 1436 1723 2010 2297 2584 2871 3158 3445 3732 4019 4306 4593 4880 5167 5454 5741 6028 6315 6602 6889 7176 7463 7750 8037 8324 8611 8898 9185 0 Figure 1: Image of a Cotton farm with respect to the time aspects of cotton growth. Figure 3: Data Model for the Wicking Experiment. Figure 6: Query code for displaying Temperature based on Experiment 1. Figure 7: Graph for Figure 5 Query results. DISCLAIMER: This material is based upon work supported by the National Science Foundation and the Department of Defense under Grant No. CNS-1263183. An opinions, findings, and conclusions or recommendation expressed in this material are those of the authors and do not necessarily reflect the views of the National Science Foundation or the Department of Defense.
