PLAN - Ingham Intermediate School District
advertisement
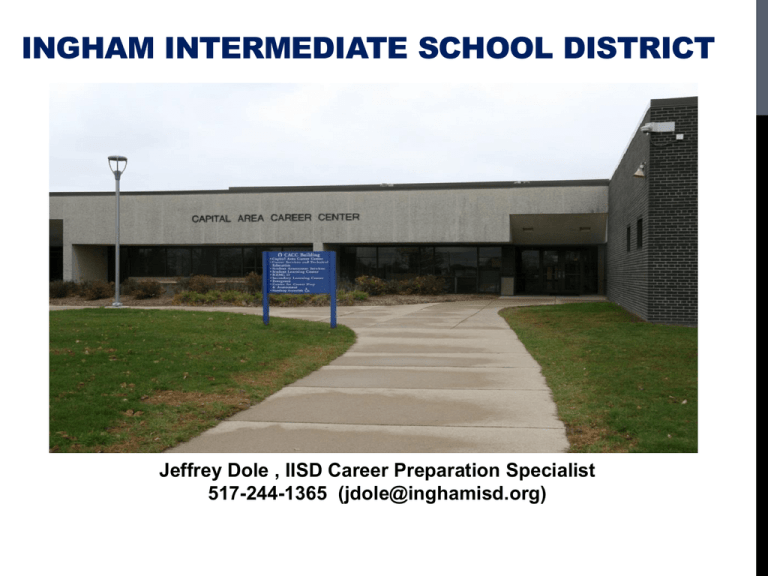
INGHAM INTERMEDIATE SCHOOL DISTRICT Jeffrey Dole , IISD Career Preparation Specialist 517-244-1365 (jdole@inghamisd.org) LEARNING GOALS: 1. Understand ACT Explore and Plan assessments. 2. Utilize a process for analyzing ACT data . 3. Understand how ACT data informs curriculum and instruction. 4. Use data to determine interventions. 5. Connecting Explore and Plan to Common Core PROCESSES, RESOURCES AND SCHEDULE 8:00 AM – 2:30 PM Lunch – On your own 11 – 12 PM • • • • PowerPoint- Discussion Individual and group work Schools sharing best practices One folder for each school TAKE YOUR LEARNING ONE STEP FURTHER Ideas going around in my mind Ideas that squared with my thinking Ideas I want to learn more about Ideas for connecting my learning “THE WILL TO SUCCEED IS NOTHING WITHOUT THE WILL TO PREPARE.” TO WHAT DEGREE DO YOU BELIEVE… ( AGREE OR DISAGREE?) All kids can learn? All kids are learning at their highest possible levels? All educators can learn? All educators are learning at the highest possible level? Data can target instruction needs? Educators target instructional needs using data? Educators should be held accountable for student growth? We will need the help of colleagues to meet the needs of all kids? Directions: Find one or more questions that resonate with you. Then find a colleague and do a 5 minute pair share. Disagree Agree WHAT YOU THINK DETERMINES… what you believe… what you say… what you do… who you are. All affect what our students learn, or do not learn. ACT IS A PIECE OF THE PUZZLE… ACT COLLEGE AND CAREER READINESS SYSTEM MEASURING STUDENT PROGRESS TOWARD READINESS IMPROVING COURSE RIGOR EXPLORE PLAN The ACT ENGAGE QualityCore 8th and 9th grade curriculum-based educational and career planning program 10th grade curriculum-based educational and career planning program 11th and 12 grade curriculum-based assessment for learning outcomes Middle and high school assessment that measures all factors of academic success Research-driven solutions for strengthening curriculum 1992 1986 PLANNING 1959 SCHOOL IMPROVEMENT SUPPORTING SOLUTIONS Core Practice Audit CoreWork Diagnostics Framework for evaluating current practices Online service to diagnose and improve content and practice areas POSSIBLE GRADES TESTED 7th grade 8th grade 9th grade 10th grade Spring 2012 EXPLORE EXPLORE PLAN (IISD) (Michigan) (IISD) PLAN (Michigan) Spring 2013 EXPLORE EXPLORE PLAN (IISD) (Michigan) (IISD) PLAN (Michigan) EXPLORE 8th and 9th grade (score range 1 to 25) PLAN 10th grade (score range 1 to 32) ACT 11th and 12th grade (score range 1 to 36) An Explore score of 23 is the same as a Plan and ACT score of 23. EXPLORE PLAN ACT 1 6 11 16 21 26 31 36 CURRICULUM-BASED ASSESSMENTS EXPLORE th 8 & 9 Grade PLAN th 10 Grade 11 & 12 Grade 1 – 25 30 minutes 6 8 11 5 5 5 40 1 – 32 30 minutes 7 9 14 6 7 7 50 1 - 36 45 minutes 10 12 18 12 11 12 75 EXPLORE th 8 & 9 Grade PLAN th 10 Grade 11 & 12 Grade 1 – 25 30 minutes 10 9 7 4 30 1 – 32 40 minutes 14 8 7 11 40 1 - 36 60 minutes 14 10 9 9 14 4 60 th Score Scales English Test (Content & number of items) Punctuation Grammar & Usage Sentence Structure Strategy Organization Style Total th Score Scales Mathematics Test (Content & number of items) Pre-Algebra Elementary Algebra Intermediate Algebra Geometry Coordinate Geometry Plane Geometry Statistics/ Probability Trigonometry Total The ACT th th The ACT th th CURRICULUM-BASED ASSESSMENTS EXPLORE th 8 & 9 Grade PLAN th 10 Grade 11 & 12th Grade 1 – 25 30 minutes 10 10 10 30 1 – 32 20 minutes 8 9 8 25 1 - 36 35 minutes 10 10 10 10 40 EXPLORE th 8 & 9 Grade PLAN th 10 Grade 11 & 12th Grade 1 – 25 30 minutes 12 10 6 28 1 – 32 25 minutes 10 14 6 30 1 - 36 35 minutes 15 18 7 40 th Score Scales Reading Test (Content & number of items) Prose Fiction Humanities Social Studies Natural Sciences Total th Score Scales ScienceTest (Content & number of items) Data Representation Research Summaries Conflicting Viewpoints Total The ACT th The ACT th Time to take the Math or Reading Test : 30 questions – 30 min AFTER TAKING THE TEST: (10 MIN) 1. What surprised you? 2. What do you think your students will struggle with most? 3. What would you tell students as you prepare them for this test? 4. Please share successful preparation strategies. PREPARING STUDENTS TO TAKE THE EXPLORE AND PLAN 1. Explain what the test is (measures knowledge) and what it is not (aptitude) . 2. Explain predictability and career exploration component of each test. 3. Explain the testing process/procedures, just like ACT. 4. Send letter home to parents. 5. Show sample problems from each test. (act.org/explore) 6. Give a practice test untimed, then timed. 7. Share test taking tips, test prep sites and resources. HELPFUL RESOURCES Career Search http://bls.gov/k12 http://michigan.gov/lmi Test Preparation http://www. Number2.com http://www.act.org http://www.mappingyour future .biz/planyoucareer/careership http://www.acinet.org http://online.onetcenter.org http://www.myskillsmyfuture.org http://www.grockit.com http://www.mel.org College Exploration http://www.collegeconfidential.com http://www.careercruising.com http://www.michigancap.org http://www.careercruising.com ACT’S COLLEGE READINESS STANDARDS™ College Readiness Standards Intervals 1-12 13-15 Example: 16-19 20-23 Mathematics 24-27 College Readiness Standards 28-32 33-36 Source: http://www.act.org/standard/pdf/CRS.pdf GLCE’and HSCE’s Common Core ACT College and Career Readiness Standards HOW IMPORTANT IS THE MIDDLE SCHOOL TO COLLEGE READINESS? College and Career Readiness DISTRIBUTION OF MICHIGAN CONTENT EXPECTATIONS IN THE COLLEGE READINESS STANDARDS Scores: 13 - 23 GLCE Scores 13 -27 Scores: 28 -36 51 77.3% 72 61.5% 15 15.2% Algebra I 8 12.1% 24 20.5% 43 43.4% Geometry 3 4.5% 7 6.0% 13 13.1% Algebra II 4 6.1% 12 10.3% 15 15.2% 66 115 86 ACT – “The Common Core State Standards Initiative is led by the National Governors Association and the Council of Chief State School Officers, in partnership with ACT, the College Board, and Achieve.” Source: ACT.org WHY SHOULD SCHOOLS OFFER THE ACT EXPLORE AND PLAN? A RESPONSE TO OUR STAKEHOLDERS 1. Predicts ACT - MME performance 2. Identifies early problems, informs interventions 3. Guides curriculum and instruction 4. Helps prepare to be college and career ready MICHIGAN DASHBOARD - 2012 Source - http://www.michigan.gov/midashboard MICHIGAN DASHBOARD - 2012 AGE OF ACCOUNTABILITY What is to be taught? MI adopts HSCE’s How do we measure student growth? Smarter Balanced Assessments - Full implementation of fully functioning assessment system Are we teaching them well? MME & MMC Teachers to begin providing instruction related to Common Core State Standards NCLB 2004 MI adopts GLCE’s 06 08 10 MI adopts Common Core 2012 2013 MI Gov. Council to develop Educator Eval. Tool based on student performance http://www.smarterbalanced.org/timeline 2014 2015 States administer summative assessments during last 12 weeks of school year INGHAM ISD COMMON CORE STANDARDS UPDATES/WORKDAY FEBRUARY 20, 2013 Updates include: An in-depth look at the Smarter Balanced Assessments. New model instructional units Critical instructional strategies for teaching the Common Core New information to help with aligning your curriculum Work time will be provided for district teams to continue alignment and gap analysis activities. For information contact: Amy Kilbridge, 517- 244- 1273 Theron Blakeslee, 517 -244-1201 COLLEGE AND CAREER READINESS DEFINING WHAT YOU WANT BEFORE YOU BEGIN TO MEASURE WHETHER YOU HAVE IT. 4 Minute Pair Share 1. ( 2 minutes) Allow partner to describe college and career readiness without interruption. 2. ( 2 minutes) switch roles ACT COLLEGE READINESS BENCHMARKS EXPLORE Test Reading College Course PLAN 8th Grade 9th Grade College Course ACT Test English Composition 13 14 15 18 English English Composition Algebra Math 17 18 19 College Algebra 22 Social Sciences 15 16 17 21 Reading Social Studies Science Biology Science English Math Biology 20 20 24 21 ACT 18 22 21 24 COLLEGE READINESS STANDARDS - ACT ACT defines “college readiness” as students having approximately a 75% chance of earning a grade of C or higher or a 50% chance of earning a grade of B or higher in first-year college English Composition; College Algebra; History, Psychology, Sociology, Political Science, or Economics; and Biology (credit- bearing courses) -ACT CAREER READINESS - CTE 1. Authentic Problem Solving Skills 2. Self- Sufficiency Skills 3. Interacting with others Skills 4. Information and technology skills 5. Communications Skills WORKKEYS® SKILL AREAS Reading for Information* Day 2 MME Applied Mathematics* Locating Information* Applied Technology Teamwork Observation Listening Writing Business Writing ** 85% of ALL occupations utilize these skills COLLEGE AND CAREER READINESS - CCSS The acquisition of the knowledge and skills a student needs to enroll and succeed in creditbearing first year courses at a postsecondary institution (college, trade school or technical school) without the need for remediation. -ACT and Common Core State Standards TWO QUESTIONS TO THINK ABOUT - 1. Are your High School graduates college and career ready? 2. How do you know? WHAT PERCENTAGE OF EDUCATORS REPORTED THAT THEIR STUDENTS ARE PREPARED FOR COLLEGE-LEVEL WORK IN THEIR CONTENT AREA? 100 90 80 70 60 50 40 30 20 10 0 Percent of respondents 91 26 High School Teachers Postsecondary Instructors Source: ACT national Curriculum Survey, 2009, pg.5, Fig 1.3 HTTPS://WWW.MISCHOOLDATA.ORG/DISTRICTSCHOOLPROFILES/REPORTCARD/EDUCATIO NDASHBOARD.ASPX ( DASHBOARD – EDIT REPORT – ENTER SCHOOL NAME) INGHAM COUNTY PUBLIC SCHOOLS Graduation rate and Dropout rate used for AYP MME % profic. (21%) Math = 57 Reading = 67 Basic Skills cut scores **Source – Mich. Graduation CCR Accreditation Comparison INGHAM COUNTY HS % PROFICIENT ON ACT ( CLASS OF 2012) COLLEGE AND CAREER READINESS ELA = 56.1% Reading = 43.7 % Math = 33.7 % Science= 27.1 % ACT English CRS = 18 ACT Reading CRS = 21 ACT Math CRS = 22 ACT Science CRS = 24 Overall = 21 % proficient on all four *** Source – Mich. Graduation CCR Accreditation Comparison LET’S LOOK AT THE CLASS OF 2015 ( 2011 8TH GRADERS) EXPLORE PROFILE SUMMARY REPORT PRESENTATION PACKET INGHAM COUNTY 8TH GRADERS 2010-2011 EXPLORE PROFILE SUMMARY RPT – INGHAM COUNTY GRADE 8 HOW DOES OUR STUDENTS’ PERFORMANCE COMPARE WITH THAT OF STUDENTS IN THE NATIONAL NORM GROUP? 25 Local National 22 19 16 14.9 15.9 14.2 17.3 15.1 15.9 15.5 13.8 16 14.9 13 10 7 4 1 English Mathematics Reading Science Composite 2010-2011 EXPLORE PROFILE SUMMARY REPORT – GRADE 8 ARE OUR STUDENTS ACHIEVING SIMILARLY ACROSS RACIAL/ETHNIC GROUPS? 25 20 African American American Indian/Alaska Native Caucasian American Hispanic/Latino Asian Native Hawaiian/Other Pacific Islander 2 or more races 18 17.9 17.4 16.8 16.6 16 16.315.6 15.9 15.7 15.6 15.5 15.4 15.3 15 14.914.814.5 15.2 14.5 14.5 15 13.9 13.7 13.6 13.4 13 13.113.3 12.3 11 11 10 5 0 English Mathematics Reading Science Composite 2010-2011 EXPLORE PROFILE SUMMARY REPORT – GRADE 8 ARE OUR STUDENTS ACHIEVING SIMILARLY ACROSS GENDER GROUPS? 25 Males Females 20 16.8 17 15 15.1 15.515.4 13.6 14.6 15.3 15.215.8 10 5 0 English Mathematics Reading Science Composite 2010-2011 EXPLORE PROFILE SUMMARY REPORT – GRADE 8 IS THE ACADEMIC ACHIEVEMENT OF OUR STUDENTS FOR THE PAST THREE YEARS IMPROVING COMPARED TO THAT OF THE NATIONAL NORM GROUP? 25 National Local 2010-2011 Local 2009-2010 Local 2008-2009 20 15 15.1 14.9 14.9 14.2 17.3 17.1 16.8 15.9 16 15.9 15.9 15.515.2 15.7 15.6 15.1 15.4 14.9 14.8 13.8 10 5 0 English Mathematics Reading Science Composite 2010-2011 EXPLORE PROFILE SUMMARY REPORT – GRADE 8 ARE OUR STUDENTS ADEQUATELY PREPARING THEMSELVES TO BE SUCCESSFUL? 20 Local 2010-2011 15.415.815.6 16.2 16.4 16 15 Local 2009-2010 15.9 15.8 15.2 Local 2008-2009 17.717.6 17.3 16.5 16.5 16.1 10 5 0 English Mathematics Reading Science Composite Core: Students who plan to take 4 or more years of English and 3 more years of mathematics, social studies & natural sciences 2010-2011 EXPLORE PROFILE SUMMARY REPORT – GRADE 8 ARE OUR STUDENTS ADEQUATELY PREPARING THEMSELVES TO BE SUCCESSFUL? 20 Local 2010-2011 Local 2009-2010 Local 2008-2009 16.616.4 15.4 15 14 14.214.1 14.814.5 16.1 14.6 14.214.1 15.3 15 14.8 10 5 0 English Mathematics Reading Science Composite Noncore: Students who do not plan to take 4 or more years of English and 3 more years of mathematics, social studies & natural sciences SAMPLE PUBLIC SCHOOL ( K – 12) Return 100 90 80 70 60 50 40 30 20 10 0 Total Students: 76.43 2686 74.3 40.7 12 35.6 34 39 17 2011 Graduation Rate % ACT College Ready % In College Remedial % MME Proficient 2011 Courses 2011 Sample Michigan This chart shows 40.7 % of the 2011 SAMPLE school graduates who took college classes after graduation took 1 or more remedial courses. Source: http://bridgemi.com/2012/05/see-how-your-local-schools-do-on-college-prep MIDASHBOARD – POST SECONDARY OUTCOMES – COLLEGE REMEDIAL COURSEWORK INGHAM COUNTY HS COLLEGE CREDITS (SPRING 2012) CACC = 193 STUDENTS EARNED 1312 TTL. CR. LCC EARLY COLLEGE = 84 STUDENTS/ 446 CREDITS ONLINE INDEPENDENT COURSES = ? ADVANCED PLACEMENT COURSE CREDITS = ? DUALLY ENROLLED = ? DISCUSSION WITHIN GROUPS ( 20 MIN) Visit the website: https://www.mischooldata.org and looking at the data specific to your district, discuss the following questions: 1. What surprised you most about the data? 2. What concerns you most? 3. What will you do with this information? WHAT IS THE CURRENT STATUS OF “COLLEGE READINESS” FOR STUDENTS IN THE STATE ? 2010-11 MICHIGAN 4-YR REGULATORY ADJUSTED C0HORT GRADUATION RATES 100 13th highest in the nation 90 80 70 60 50 40 30 20 10 0 State focus STATES WITH 100% OF STUDENTS TESTING 2012 10th graders who took the PLAN We can do better for our students! Student Name Student Name Student Name Student Name Student Name Student Name Student Name Student Name Student Name Student Name Student Name Student Name Student Name Student Name Student Name Student Name Student Name Student Name Student Name Student Name Student Name Student Name Student Name Student Name Student Name Student Name Student Name Student Name Student Name Student Name Student Name Student Name Student Name Student Name Student Name Student Name WEIGHING THE PIGS DOESN’T MAKE THEM ANY FATTER!!! THREE WAYS TO GET BETTER FIGURES 1. Distort the figures. 2. Distort the system. Get demonstrated results at the expense of other results. 3. Improve the system. Brian Joiner, Joiner Associates “ Wherever there’s fear, you’ll get wrong figures. It’s what people think that counts.” David Langford WHAT CAN WE DO TO RAISE OUR SCORES? 1. Quality teachers and rigorous, relevant curriculum have the greatest impact. There is no substitute for quality instruction in the classroom. 2. Use data for school improvement and to assist individual students. - Revisiting curriculum and instruction - Integrate targeted ACT prep activities and remediation 3. Appropriate interventions at all 3 tiers 4. Stakeholder involvement ( Students, Parents, admin. Board) ** building a culture focused on College and Career readiness ACT SCHOOL REPORTS Student Report Profile Summary Report Early Intervention Roster Item Response Summary ACT COLLEGE & CAREER READINESS INFORMATION SYSTEM Five years of data for EXPLORE/PLAN/ACT • Down to the student level • At the aggregate level • Follow cohorts as they move through • Item-analysis to the standard level, including common core! Estimated release – Spring 2013 Interpreting the EXPLORE/PLAN Student Report ANN TAYLOR AND MARCUS JONES - 2012 Ann – Struggles in school Does not like math or science. Spends a lot of time with friends EXPLORE score = 15 Marcus – Does well in school without much effort. Enjoys reading Active in sports. EXPLORE score = 18 Future Spartans?? USING YOUR EXPLORE RESULTS Score Report EXPLORE Interpretive Visuals 78 9/2008 YOUR SCORES Slide 79 Slide 80 Understanding Your Explore Results Estimated PLAN Composite Score Range EXPLORE Interpretive Visuals 81 9/2008 Using Your Explore Results High School Graduation Requirements EXPLORE Interpretive Visuals 9/2008 82 PROFILE FOR SUCCESS Slide 83 WHAT IS A TWO POINT IMPROVEMENT WORTH? • 1. More schools to choose • 2. More scholarships • 3. Greater earning potential Slide 84 Admissions Guidelines for Michigan schools 2011/2012 Michigan Colleges U of M Ann Arbor GPA: 3.8 ACT: 29 - 33 Kalamazoo College GPA: 3.65 ACT: 26 - 31 GPA: 3.4 ACT: 23 - 28 Alma College GPA: 3.5 avg. ACT: 21 - 27 CMU WMU SVSU GPA: 3.3 ACT: 22 avg GPA: 2.9-3.3 ACT: 22/ 17 min Ferris State GPA: 2.5 avg. ACT: 18 - 24 Community Colleges High School Graduation or GED Michigan State University Central Michigan University CAREER CRUISING 1. Select Schools 2. Type in school name 3. Select Enrollment 4. Scroll down to ACT charts. School Michigan State University Average ACT (ACT Middle 50%) 30 Preferred, but if core course is taken in lieu of, it is waived Sliding Scale 2 years for LSA college but none in other colleges 24-28 U of M AA 28-32 Grand Valley 22-26 U of M Dearborn ACT Scores For ScholarshipiQualification Language Requiring @2nd Lang Req 25 Laker Dean Faculty Presidential 23 26 29 32 Maize and Blue Dean Chancel lors 25 27 31 No No Western Michigan 23 26 No Wayne State University 21 25 No Eastern Michigan University 20-21 Presidential No 21 Alma College 22 Trustee Dean Presidential 20 25 28 No, but recommended GRADUATE EARNING POWER School Graduate Starting Salary Graduate Mid-Career Salary Princeton 58,000 123,000 Harvard 57,000 121,000 Michigan 50,000 90,000 Michigan Tech 50,000 90,000 MSU 44,000 81,000 WMU 41,000 74,000 EMU 38,000 71,000 Ferris 42,000 70,000 CMU 40,000 65,000 GVSU 37,000 63,000 Wayne State 36,000 59,000 Student Data Analysis A 4-step process 1.Identify the incorrect answers 2.Determine cause of incorrect response 3. Identify and prioritize improvements 4.Complete T-Chart SAMPLE: Test Results Item Analysis sheet EXPLORE MATH 04A -STUDENT SCORE REPORT and test booklets Item Analysis for Students STEP ONE: As you review the MATH section questions and answers with your teacher, circle whether your answer was correct or incorrect. This will allow you to focus on the strong items as well as those that may need to be readdressed. NOTE- Look closely at the number of the test item; they are not in order. They are grouped by the skill being measured. Pre-Algebra 1. B 4. G 7. A Student Results Correct Incorrect Correct Incorrect Correct Incorrect Notes Step 2 Step 1 Algebra 5. A Student Results Correct Incorrect Notes STEP TWO: Look carefully at the question and try to decide what caused you to select the wrong answer and make notes in the area provided. • Is it a content problem (something that you have not yet learned or mastered)? • Is it the question type (perhaps you are unfamiliar with the way the question is worded or how the information is presented)? • Is it a testing issue (did the you get tired of testing or run out of time or just make a simple mistake)? STEP THREE: You now have a more clear indication of the areas that you may need to work on after completing steps one and two. On the back of your student score report there are suggestions of things that you can work on if you have weaknesses in particular areas. Put check marks next to the suggestions which would help you be prepared for the ACT next school year. STEP FOUR: Complete the strength and weakness T-chart and the reflection paragraph based on the information you have gathered from steps one, two and three. This will help you process your areas of strength and weakness and develop an action plan for improvement. Using Your Plan Results Step 3 – Check improvements Your Skills 91 Step 4 Students keep this document in their portfolio and share with parents during conferences or parent meeting. Current math score = _____ Growth score goal for PLAN/ACT = _____ Career and College interests - USING THE T- CHARTS •Teachers use these responses to assist with differentiation in the classroom. •Share with parents during conferences or parent informational meeting. ESSENTIAL QUESTIONS: 1. How much growth in academic achievement typically occurs during high school? 2. Can growth be accelerated so that more students are ready for college and career when they graduate from high school? 3. Do growth rates differ depending on the degree to which students are on target to becoming college and career ready? AVERAGE GROWTH BETWEEN EIGHTH AND TWELFTH GRADES Source: ACT – Issues In College Readiness, How Much Growth toward College Readiness is Reasonable to Expect in High School?, 2009 BETWEEN EIGHTH AND TWELFTH GRADES, BY DEGREE OF COLLEGE READINESS ENGLISH MATHEMATICS READING SCIENCE CHART SUMMARY Groups of students who were on target in 8th grade were the only students who stayed on target in 10th grade and went on to become ready for college level work by high school graduation. HELPING STUDENTS SETS ATTAINABLE GOALS REASONABLE – INDIVIDUAL STUDENT GROWTH GOALS ACT RECOMMENDATION Goal for students off target– On successive tests, reduce by ½ the difference between the students score on a given subject and the corresponding College Readiness Benchmark. Example – Explore Reading student score = 11 ( 4 pts below benchmark of 15) PLAN Benchmark for English = 17 4/2 = 2 17 – 2 = 15 therefore the growth goal for this student is to get a 15 on the PLAN reading test. ACT RECOMMENDATION FOR GROWTH GOALS Goal for students nearly on target in 8th grade – Meet benchmarks on the PLAN and exceed benchmarks on ACT . Goal for students on target at 8thgrade – Exceed benchmark scores on PLAN and ACT by 2 – 3 pts. or more OR have students focus on the post secondary goals EXPLORE 19 PLAN 22 ACT (MSU) 25 ITEM RESPONSE - WHAT IT SHOWS US: Percentage who selected the correct and incorrect response for each question. Average percentage who responded correctly in each content area. Reference group results to show comparison. ITEM ANALYSIS BY TEACHERS/DEPARTMENTSTODAYS WORK Goal: Analyze student data to inform strengths and weaknesses in curriculum and instruction. 4 Steps: 1. Complete the analysis worksheet for the reading test. 2. Create Strengths and Weaknesses charts. (B.O.B.’s & W.O.W.’s) 3. Complete Content Expectations Chart 4. Complete School Improvement Planning Template ITEM ANALYSIS BY TEACHERS STEP 1 – COMPLETE THE ITEM ANALYSIS WORKSHEET. DEPARTMENT - Look at the test booklets and the actual items. Then look at this years Item Response data, and considering the last three years data ( if available) determine the appropriate percentage to isolate items which are Strengths and Weaknesses . At what % will you consider the items to be a curriculum and/or instructional Strength and Weakness? INDIVIDUALLY - Complete the worksheet notes as you look over the test booklet. Then discuss as a department: Why do you think your students did well on the strengths items? Why do you think your students did not do well on the weakness items? ITEM RESPONSE SUMMARY REPORT CCRW Manual p. 94 Math: PLAN Test Results Item Analysis for Staff STEP ONE: As you review the Math section questions and answers, if the students have an _____% or higher on an item, circle “strength” and if the students have a _____ % or less on an item, circle “weakness.” This will allow us to focus on very strong items and those that we need to readdress. INDIVIDUALLY make any necessary notes that you notice about each type of question (content issue, question type or testing issue). Pre- Algebra > 80% < 60% Notes 1. AF Strength Weakness 11. BG Strength Weakness 21. AF Strength Weakness 25. DJ Strength Weakness 32. BG Strength Weakness 37. BG Strength Weakness Elementary Algebra 7. CH 12 AF 14. CH 16. BG 24. AF 27. DJ 29. AF > 80% Strength Strength Strength Strength Strength Strength Strength Geometry 2. CH 4. DJ 5. AF 10. BG > 80% Strength Strength Strength Strength < 60% Weakness Weakness Weakness Weakness 17. Strength Weakness DJ < 60% Weakness Weakness Weakness Weakness Weakness Weakness Weakness Notes Notes STEP 2 – CUT STRENGTHS AND WEAKNESSES ITEMS AND PASTE TO CHART PAPER College Readiness Standard: Math - Expressions, Equations, and Inequalities (XEI): 601 (28-32) – Manipulate expressions and equations MATH DEPARTMENT - 2 CHARTS Strengths Item’s 1,5,22 Calculating the average, given frequency counts of all the data values Items 4,13, 18, 23 Order of operations Weaknesses Item’s 3,9, 18, 27 Recognizing equivalent fractions and fractions in lowest terms STEP 3 – AS A DEPARTMENT, COMPLETE THE CONTENT EXPECTATION CHART. 1. 2. 3. 4. 5. Content of weaknesses Essential Learning Skills using ACT CRS Chapter, section, unit taught (SKIP) Test taking concerns Instructional strategies to implement WHAT WHAT WHERE WHY HOW “The true value is in the process not the product.” * * * Completed as a department * WHAT IS GOOD INSTRUCTION? Will the students be engaged? Please focus on GOOD instruction when planning for the Instructional Strategies to Implement piece. Step #3 What toolbox strategies will be most effective? Do I need to differentiate instruction? Are there other strategies that can be used which are not in the toolbox? Building coherence between MS and HS curriculum ITEM ANALYSIS BY TEACHERS STEP 4- COMPLETE SCHOOL IMPROVEMENT PLANNING TEMPLATE. BASED ON THE DATA YOU HAVE JUST ANALYZED: 1. Write a statement of gap in student achievement 2. Fill in the contributing cause for the gap in student achievement. 3. Create a measurable objective statement to support the goal. 4. Create some possible strategy statements. Step #4 MICHIGAN DEPARTMENT OF EDUCATION CNA. SIP REVISED.V13.2010 1. Based on a review of the data and the staff discussion around the questions and proceeding pages, state the schools conclusions regarding the strengths and challenges ( weaknesses)of the students learning need. Strengths: Challenges: 2. For the challenges above, what content area goals have the school established for student achievement that will addressed in the school improvement plan Content Area: ________________________________ Student Achievement Goals: ____________________________________________________________________________________________________ ____________________________________________________________________________________________________ 3. For the goals listed above, what did the school student data identify as the gap between where current student achievement is and where the building would like to be? Content Area: ________________________________ Student Achievement Goals: ____________________________________________________________________________________________________ ____________________________________________________________________________________________________ 4. For each of the identified gaps listed above, based on the school’s discussion and current trends in student learning, what has the school determined to be the leading cause(s) for the gap in performance? Content Area: ________________________________ Student Achievement Goals: ____________________________________________________________________________________________________ ____________________________________________________________________________________________________ ____________________________________________________________________________________________________ DISTRICT/BUILDING GOALS Important for everyone to be on the same page. • Belief in a Pre K-12 system •Knowledge of Common Core and College Readiness • Shared vocabulary and expectations Building on each other’s goals, sharing information and developing commonalities DISTRICT GOALS All graduates of the _____ Public Schools will be College Ready, Career Ready and Life Ready in English Language Arts. All graduates of the _______ Public Schools will be College Ready, Career Ready and Life Ready in Mathematics. All graduates of the _______Public Schools will be College Ready, Career Ready and Life Ready in Science. WORK TIME 4 Steps: 1. Complete the analysis worksheet for the EXPLORE reading test 2. Create Strengths and Weaknesses charts. (B.O.B.’s & W.O.W.’s) 3. Complete Content Expectations Chart 4. Complete School Improvement Planning Template COMMON CORE CONNECTION: INSTRUCTIONAL STRATEGIES Shared responsibility for students’ literacy development Pg. 4 - Common Core State standards for ELA and Literacy in History/Social Studies, Science, and Technical Subjects WHAT ABOUT AFTER TODAY? Use weakness items as openers. Find out why students are struggling. Give PLAN just like the ACT Create assessment items similar to ACT Get stakeholders invested. Use supplemental questions. Complete planning template Creating Interventions of support Social Studies Use the diagrams below to answer questions 5-8. On the left is a climograph for southern Africa, the right is a map showing the direction ocean currents move on the east and west coast of the country. Southern Africa is in the southern hemisphere, so the warmer regions should be in the north and cooler regions should be farther south. Inferential (Book/Brain) Reading Charts 5. Which statement best explains the difference in the average yearly temperature range for Walvis Bay & Gaborone? a. Walvis Bay is farther inland which heats up and cools down faster than coastal cities. b. Gaborone is located farther from the equator and receives less solar energy from the sun. c. Gaborone is located closer to the equator and receives more solar energy from the sun. d. Walvis is closer to the ocean which keeps the temperatures fairly consistent throughout the year. Back POST TEST PARENT MEETING ( AGENDA) During the parent session we will: • Review basic fundamentals of the Explore, Plan and ACT/MME assessments • Hand out and explain the various components of the Student Score Report • Identify how Explore and Plan results can help students prepare for the ACT • Have students share T- charts with parents SECTION V – SUPPLEMENTAL LOCAL ITEMS Please indicate how much you agree or disagree with each of the following statements: (a) Strongly agree (b) Agree (c) Disagree (d) Strongly disagree (e) Not sure 1. 2. 3. 4. 5. I get the support I need from my teachers. I usually feel nervous/stressed/anxious about test taking. The classes at my school are interesting and challenging. I learn a lot from working in groups. The classes I am taking are properly preparing me for life beyond high school. 6. I know where to get help when I am struggling in school. 7. I have a career and/or college plan after high school. POSSIBLE INTERVENTIONS District Initiative – Pyramid of intervention training for staff. District Interventions for Students – Summer programs, universal screening Building Interventions – Academic Center support, Blended Service model, Math Lab, Reading Lab, Before/ After school academic support and Title 1 support. CONCLUSION Use all ACT data reports as one source to measure student growth. Involve students, parents and staff in the data analysis Much of the ACT is middle school content Student who are on target tend to stay that way. Students who are off target need interventions before and throughout high school Setting reasonable, yet challenging , growth goals for all students is one way of helping them stay on track SHARING PROGRESS/ADVICE Diane Newman Haslett HS RtI Coach EXPLORE, PLAN AND ACT ACTION PLANNING 1. Who will take new information about preparing for EXPLORE/PLAN/ACT back to your building/ 2. Who will present the new information? 3. Have you created a building-wide schedule for practice tests? 4. Who will coordinate the schedule? Organize materials? 5. Do we have a literacy across the curriculum focus in your building? 6. If not, who would initiate implementation of a school-wide literacy focus? 7. Do you have interventions in place for struggling readers? CONTACT INFORMATION Jeffrey Dole IISD Career Preparation Specialist 517-244-1365 jdole@inghamisd.org
