TAFE Dairy course - Irrigation
advertisement
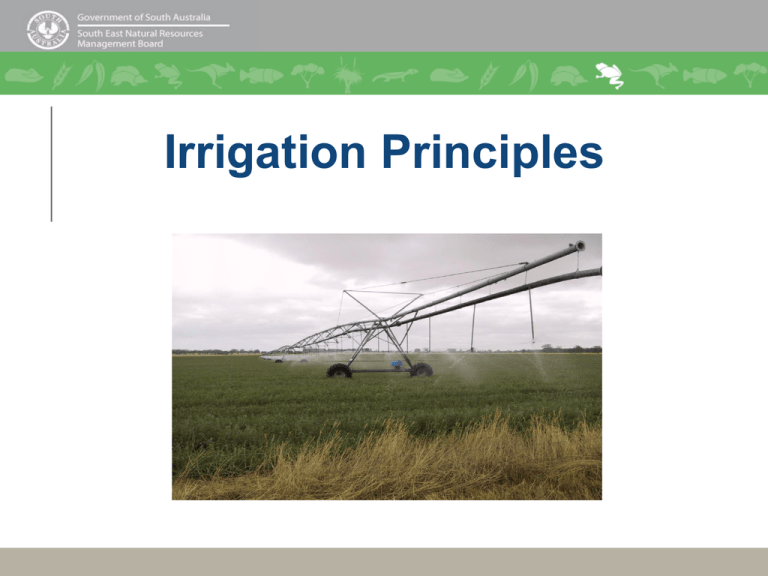
Irrigation Principles What is Irrigation Efficiency? Irrigating efficiently means: • applying the right amount of water, • at the right time, • evenly and reliably, • to achieve maximum crop production, • and minimal detrimental impacts on the environment What is irrigation efficiency? In developing best practice irrigation management, a number of performance indicators are assessed and compared, which include: • irrigation volumes pumped • irrigation volumes applied • crop water use • cost of water • crop productivity • economic return Irrigation Best Management Practices • Rate irrigation highly within the management system • Get to know the soils on the property • Design and maintain irrigation systems correctly • Monitor all aspects of each irrigation event • Use objective monitoring tools to schedule irrigation • Use more than one tool for scheduling irrigation • Retain control of irrigation scheduling • Remain open to new information (PIRSA, 2007) Terms Soil Water Content: Measure of amount of water held in the soil, measured in millimetres per metre of soil depth (mm/m), and sometimes expressed in millimetres of water within the crop rootzone (mm). Related to soil water tension according to soil texture and structure. Soil Water Tension: Measure of the amount of force (suction) required to draw water from the soil, measured in negative kilopascals, or kilopascals of suction (-kPa). Related to soil water content according to soil texture and structure. Terms Field Capacity: Level of soil water at which the soil is holding the maximum amount of water, allowing for drainage of excess water by gravity. Generally corresponds to a soil water tension of –8kPa. Refill Point: Soil water tension or content at which the irrigator chooses to apply irrigation to refill the rootzone water store. May correspond to soil water tension of –60kPa for many permanent plantings, but can be much wetter or dryer, depending on crop type, growth stage, management preference etc. The main aim though, is to replace the amount of water that has been used by the crop and to re-irrigate before crop water use slows down, unless the crop is being stressed for a particular purpose. Terms Permanent Wilting Point: Soil water content or tension at which plants can no longer withdraw water from the soil, leading to plant death. Generally corresponds to a soil water tension of -1500kPa. Readily Available Water (RAW): The amount of water held in the soil between Field Capacity and a Refill Point generally corresponding to a soil water tension of –60kPa, measured in millimetres of water per metre of soil depth (mm/m). Crop Water Use Affected by: • Soil type • Climate • Plant growth and development • Irrigation system type and management of that system Crop Water Use rainfall irrigation transpiration evaporation runoff +excesss rain +leaching salt +excess irrigation +watering uniformity drainage Water Usage: Irrigation Scheduling Why schedule? • Scheduling involves deciding when to irrigate and how much water to apply. • The aim of irrigation scheduling is to keep soil water within an acceptable range, avoiding plant stress by not allowing your soils to remain too dry or too wet. • Scheduling makes the best use of your irrigation water. • Plants that are not water stressed have the potential to produce optimum yields and remain healthy and vigorous. Water Usage: Irrigation Scheduling The benefits of irrigation scheduling are: • optimising plant health; • using irrigation water efficiently and effectively; • maximising productivity; • minimising the leaching fraction which reduces drainage and nutrient loss; • using irrigation water in an environmentally responsible manner. Water Usage: Irrigation Scheduling The dangers of not scheduling: Over-irrigation, which: • causes waterlogging and reduces plant health; • wastes water with unnecessary pumping and water costs; • leaches nutrients out of the plant root zone; • produces excess drainage water; Under-irrigation, which: • stresses plants and reduces plant productivity; • causes nutrient deficiency; • may cause salt damage. Water Usage: Irrigation Scheduling Types of scheduling: •Soil – based scheduling •Climate – based scheduling •Plant – based scheduling Soil Water Monitoring Devices Tensiometers: • placed in rootzone to indicate crop available water • drying soil exerts suction on tensiometer water which registers on gauge • needs good contact with soil (not suitable for cracking soils and coarse sandy soils) • suitable for tensions up to -85 kPa Soil Water Monitoring Devices Gypsum Blocks: • readings represent the suction plants need to exert through there roots to obtain water • measurements read by portable handheld meter/logger • GB Heavy (finer textured soils, low sensitivity 0 to -50 kPa, accurate in very dry soils up to -1500 kPa) • GB Light (suitable for lighter/sandier soils, sensitive from -10 to -200 kPa) Soil Water Monitoring Devices Other devices include: • Neutron Probes • Capacitance Probes • Heat Probes • Time Domain Reflectometers Comparing Devices • Range of measurement required • Number of monitoring sites required (soil variation, crop, irrigation system) • Level of detail required (frequency of readings) • Level of input available (time, employees) • Backup (hardware, software, installation, calibration, interpretation) • System output (ease of interpretation) • Price (initial and recurrent) Where not to place devices Outside rows: Outside rows are exposed to wind, especially on the edges of roads or adjoining broad acre properties. Wheel tracks / Gateways / Stock traffic areas: Soil is compacted and may lead to inaccurate readings. Disturbed soil: Sites where the soil has been disturbed can give inaccurate readings. Stunted or sick plants: Sick plants usually use less water. Areas with poor sprinkler distribution uniformity: Can give readings not representative of the whole shift. Areas with shallow watertables: Rising watertables may be detected giving a false impression of water needs across the crop. Pasture or broad acre areas sheltered by trees or shelter belts: Shading and shelter effect transpiration, and tree roots may rob soil water. Climate-based Scheduling • Daily crop water requirement (CWR) = monthly CWR ÷ no. of days in the month • Approx irrigation interval (days) = rootzone RAW ÷ daily CWR Climate-based Scheduling • Monthly crop water requirement (CWR) = monthly evapotranspiration x crop factor •Crop factor: percentage of water used by the crop when compared to evapotranspiration readings from a theoretical crop. Calculated for each crop by researchers comparing crop water usage and evaporation. Available from PIRSA and SENRMB sites •Access evapotranspiration figures for your area from the Bureau of Meteorology or nrmWEATHER Crop factors should only be regarded as a guide. Site specific crop factors can be developed over time by the irrigator. Climate-based Scheduling Climate-based Scheduling • Similarly ETo data can be used, in conjunction with a reference crop factor, to calculate soil water used on a daily basis • Arrival at refill point can be determined by summing calculated daily crop water use • ETo calculated by Bureau of Meteorology, AWS • Soil-based scheduling should compliment climatebased scheduling Climate-based Scheduling Plant-based Scheduling • Plant appearance (need to be careful wilted appearance isn’t due to factors other than lack of water) • Sap flow meters Meters • Do not under estimate the importance of the pump meter as a vital part of irrigation scheduling and management • Meters allow the user to determine accurate volumes of irrigation water pumped Distribution Uniformity and Application Efficiency • Pivot should be checked on regular basis throughout its life (first test should be after pivot construction) to ensure reasonable distribution of water along the spans • Application efficiency and distribution uniformity can be determined with catch can test • Distribution uniformity calculated, via software package, to show variation in water output along pivot spans • Compare water pumped (from meter reading) with catch can measurements to determine application efficiency CATCH CAN METHODOLOGY Objectives To calculate property level water balances. To determine application and transmission losses and Application efficiency. Methodology Measure pivot Read meter Place catch cans Record weather conditions Record volumes caught by cans Reread meter Perform calculations Pivot Pivot Size (m) Number Time of Irrigation Event Application Average Estimated Depth range (mm) Application per Pass mm Application Application Loss (%) Efficiency % 1 320 Day 17- 21 19.4 30 70 2 310 Night 17- 30 23.9 9 90.7 3 268 Night 1.4- 9.2 6 18 82.1 4 324 Night 5.5- 7.5 6.6 7 93.1 5 421 Night 10.5- 14 12.2 14 85.7 6 427 Day 9- 20.5 15.5 12 88 7 454 Day 10- 17 13.6 10 90 Future Water Usage • Drive to increase efficient and effective use of groundwater may mean we have to use pivots differently • There will be a bigger requirement to extract the greatest dollar value return for every Megalitre pumped • Choosing what to grow under the pivot will become increasingly important • Pasture vs Crops Acknowledgements The South East Natural Resources Management Board gratefully acknowledges the following information providers: • Rural Solutions SA – Irrigated Crop Management Service • Department for Environment, Water and Natural Resources
