Gliderpalooza 2013: So Much More Than Gliders
advertisement
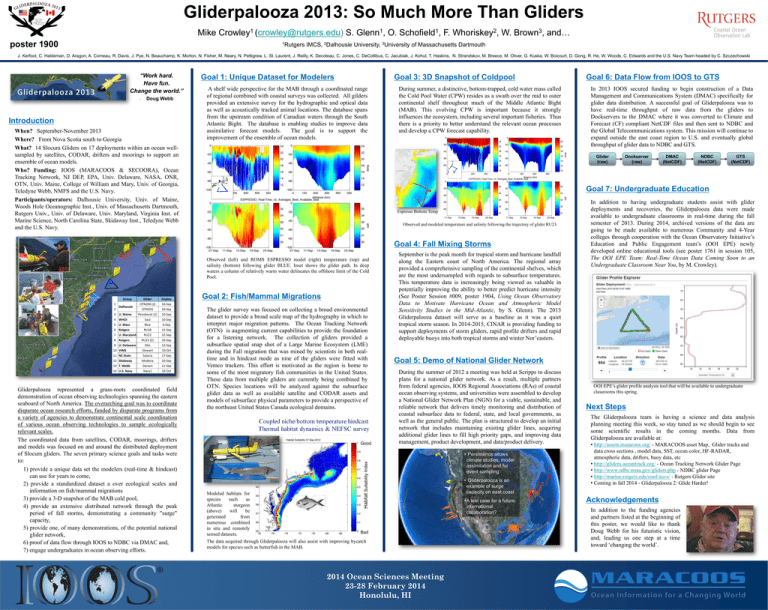
Gliderpalooza 2013: So Much More Than Gliders Mike Crowley1 (crowley@rutgers.edu) S. Glenn1, O. Schofield1, F. Whoriskey2, W. Brown3, and… poster 1900 1Rutgers IMCS, 2Dalhousie University, 3University of Massachusetts Dartmouth J. Kerfoot, C. Haldeman, D. Aragon, A. Comeau, R. Davis, J. Pye, N. Beauchamp, K. Morton, N. Fisher, M. Neary, N. Pettigrew, L. St. Laurent, J. Reilly, K. Decoteau, C. Jones, C. DeCollibus, C. Jacubiak, J. Kohut, T. Haskins, N. Strandskov, M. Breece, M. Oliver, G. Kuska, W. Boicourt, D. Gong, R. He, W. Woods, C. Edwards and the U.S. Navy Team headed by C. Szczechowski “Work hard. Have fun. Change the world.” - Doug Webb Introduction When? September-November 2013 Where? From Nova Scotia south to Georgia What? 14 Slocum Gliders on 17 deployments within an ocean wellsampled by satellites, CODAR, drifters and moorings to support an ensemble of ocean models. Who? Funding: IOOS (MARACOOS & SECOORA), Ocean Tracking Network, NJ DEP, EPA, Univ. Delaware, NASA, ONR, OTN, Univ. Maine, College of William and Mary, Univ. of Georgia, Teledyne Webb, NMFS and the U.S. Navy. Participants/operators: Dalhousie University, Univ. of Maine, Woods Hole Oceanographic Inst., Univ. of Massachusetts Dartmouth, Rutgers Univ., Univ. of Delaware, Univ. Maryland, Virginia Inst. of Marine Science, North Carolina State, Skidaway Inst., Teledyne Webb and the U.S. Navy. Goal 1: Unique Dataset for Modelers Goal 3: 3D Snapshot of Coldpool A shelf wide perspective for the MAB through a coordinated range of regional combined with coastal surveys was collected. All gilders provided an extensive survey for the hydrographic and optical data as well as acoustically tracked animal locations. The database spans from the upstream condition of Canadian waters through the South Atlantic Bight. The database is enabling studies to improve data assimilative forecast models. The goal is to support the improvement of the ensemble of ocean models. During summer, a distinctive, bottom-trapped, cold water mass called the Cold Pool Water (CPW) resides as a swath over the mid to outer continental shelf throughout much of the Middle Atlantic Bight (MAB). This evolving CPW is important because it strongly influences the ecosystem, including several important fisheries. Thus there is a priority to better understand the relevant ocean processes and develop a CPW forecast capability. Espresso Bottom Temp Observed and modeled temperature and salinity following the trajectory of glider RU23. OTN200 (2) 10-Sep OTN201 16-Sep Penobscot (2) 10-Sep 4 WHOI Saul 10-Sep 5 U. Mass Blue 6-Sep 6 Rutgers RU28 12-Sep 7 U. Maryland RU22 22-Sep RU23 (2) 10-Sep Otis 12-Sep 10 VIMS Stewart 10-Oct 11 NC State Salacia 17-Sep 12 Skidaway Modena 10-Sep 13 T. Webb Darwin 11-Sep 14 U.S. Navy Navy1 10-Oct 1 2 Dalhousie 3 U. Maine 8 Rutgers 9 U. Delaware Gliderpalooza represented a grass-roots coordinated field demonstration of ocean observing technologies spanning the eastern seaboard of North America. The overarching goal was to coordinate disparate ocean research efforts, funded by disparate programs from a variety of agencies to demonstrate continental scale coordination of various ocean observing technologies to sample ecologically relevant scales. The coordinated data from satellites, CODAR, moorings, drifters and models was focused on and around the distributed deployment of Slocum gliders. The seven primary science goals and tasks were to: 1) provide a unique data set the modelers (real-time & hindcast) can use for years to come, 2) provide a standardized dataset a over ecological scales and information on fish/mammal migrations 3) provide a 3-D snapshot of the MAB cold pool, 4) provide an extensive distributed network through the peak period of fall storms, demonstrating a community "surge" capacity, 5) provide one, of many demonstrations, of the potential national glider network, 6) proof of data flow through IOOS to NDBC via DMAC and, 7) engage undergraduates in ocean observing efforts. Goal 2: Fish/Mammal Migrations The glider survey was focused on collecting a broad environmental dataset to provide a broad scale map of the hydrography in which to interpret major migration patterns. The Ocean Tracking Network (OTN) is augmenting current capabilities to provide the foundation for a listening network. The collection of gliders provided a subsurface spatial snap shot of a Large Marine Ecosystem (LME) during the Fall migration that was mined by scientists in both realtime and in hindcast mode as nine of the gliders were fitted with Vemco trackers. This effort is motivated as the region is home to some of the most migratory fish communities in the United States. These data from multiple gliders are currently being combined by OTN. Species locations will be analyzed against the subsurface glider data as well as available satellite and CODAR assets and models of subsurface physical parameters to provide a perspective of the northeast United States Canada ecological domains. Good September is the peak month for tropical storm and hurricane landfall along the Eastern coast of North America. The regional array provided a comprehensive sampling of the continental shelves, which are the most undersampled with regards to subsurface temperatures. This temperature data is increasingly being viewed as valuable in potentially improving the ability to better predict hurricane intensity (See Poster Session #009, poster 1904, Using Ocean Observatory Data to Motivate Hurricane Ocean and Atmospheric Model Sensitivity Studies in the Mid-Atlantic, by S. Glenn). The 2013 Gliderpalooza dataset will serve as a baseline as it was a quiet tropical storm season. In 2014-2015, CINAR is providing funding to support deployments of storm gliders, rapid profile drifters and rapid deployable buoys into both tropical storms and winter Nor’easters. DMAC (NetCDF) NDBC (NetCDF) GTS (NetCDF) In addition to having undergraduate students assist with glider deployments and recoveries, the Gliderpalooza data were made available to undergraduate classrooms in real-time during the fall semester of 2013. During 2014, archived versions of the data are going to be made available to numerous Community and 4-Year colleges through cooperation with the Ocean Observatory Initiative’s Education and Public Engagement team’s (OOI EPE) newly developed online educational tools (see poster 1761 in session 105, The OOI EPE Team: Real-Time Ocean Data Coming Soon to an Undergraduate Classroom Near You, by M. Crowley). Goal 5: Demo of National Glider Network During the summer of 2012 a meeting was held at Scripps to discuss plans for a national glider network. As a result, multiple partners from federal agencies, IOOS Regional Associations (RAs) of coastal ocean observing systems, and universities were assembled to develop a National Glider Network Plan (NGN) for a viable, sustainable, and reliable network that delivers timely monitoring and distribution of coastal subsurface data to federal, state, and local governments, as well as the general public. The plan is structured to develop an initial network that includes maintaining existing glider lines, acquiring additional glider lines to fill high priority gaps, and improving data management, product development, and data/product delivery. Habitat Suitability Index Deploy Dockserver (raw) Goal 7: Undergraduate Education Observed (left) and ROMS ESPRESSO model (right) temperature (top) and salinity (bottom) following glider BLUE. Inset shows the glider path. In deep waters a column of relatively warm water delineates the offshore limit of the Cold Pool. Glider In 2013 IOOS secured funding to begin construction of a Data Management and Communications System (DMAC) specifically for glider data distribution. A successful goal of Gliderpalooza was to have real-time throughput of raw data from the gliders to Dockservers to the DMAC where it was converted to Climate and Forecast (CF) compliant NetCDF files and then sent to NDBC and the Global Telecommunications system. This mission will continue to expand outside the east coast region to U.S. and eventually global throughput of glider data to NDBC and GTS. Glider (raw) Goal 4: Fall Mixing Storms Group Goal 6: Data Flow from IOOS to GTS Modeled habitats for species such as Atlantic sturgeon (above) will be generated from numerous combined in situ and remotely Bad sensed datasets. The data acquired through Gliderpalooza will also assist with improving bycatch models for species such as butterfish in the MAB. 2014 Ocean Sciences Meeting 23-28 February 2014 Honolulu, HI • Persistence allows climate studies, model assimilation and for event sampling • Gliderpalooza is an example of surge capacity on east coast • A test case for a future international collaboration? OOI EPE’s glider profile analysis tool that will be available to undergraduate classrooms this spring. Next Steps The Gliderpalooza team is having a science and data analysis planning meeting this week, so stay tuned as we should begin to see some scientific results in the coming months. Data from Gliderpalooza are available at: • http://assets.maracoos.org/ - MARACOOS asset Map, Glider tracks and data cross sections , model data, SST, ocean color, HF-RADAR, atmospheric data, drifters, buoy data, etc • http://gliders.oceantrack.org/ - Ocean Tracking Network Glider Page • http://www.ndbc.noaa.gov/gliders.php - NDBC glider Page • http://marine.rutgers.edu/cool/auvs/ - Rutgers Glider site • Coming in fall 2014 - Gliderpalooza 2: Glide Harder! Acknowledgements In addition to the funding agencies and partners listed at the beginning of this poster, we would like to thank Doug Webb for his futuristic vision, and, leading us one step at a time toward ‘changing the world’.
