Transient Climate Response to cumulative carbon emissions (TCRE)
advertisement
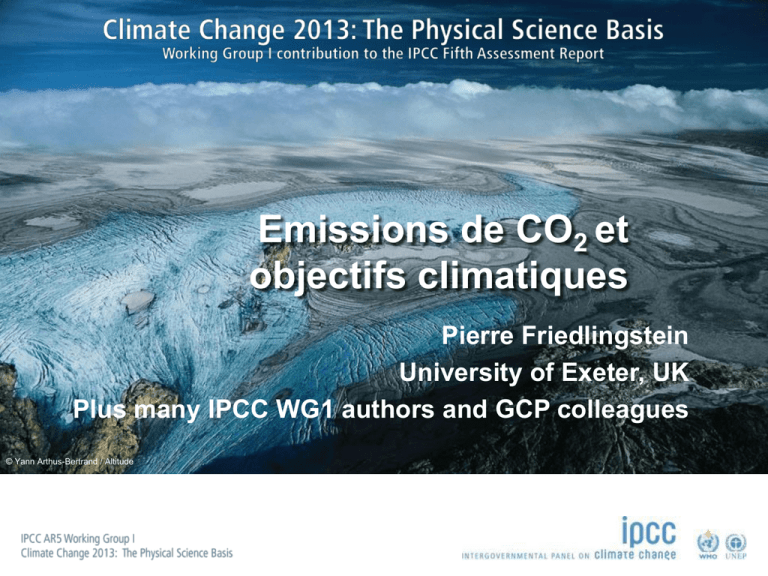
Emissions de CO2 et objectifs climatiques Pierre Friedlingstein University of Exeter, UK Plus many IPCC WG1 authors and GCP colleagues © Yann Arthus-Bertrand / Altitude Recent trends in anthropogenic CO2 emissions Fossil Fuel and Cement Emissions Fossil Fuel and Cement Emissions Global fossil fuel and cement emissions: 9.7 ± 0.5 GtC in 2012 Projection for 2013 : 9.9 ± 0.5 GtC, 61% over 1990 2003-2012 average: 8.6 ± 0.4 GtC Uncertainty is ±5% for one standard deviation (IPCC “likely” range) Source: Le Quéré et al 2013; CDIAC Data; Global Carbon Project 2013 Emissions from Coal, Oil, Gas, Cement Share of global emissions in 2012: coal (43%), oil (33%), gas (18%), cement (5%), flaring (1%, not shown) Source: CDIAC Data; Le Quéré et al 2013; Global Carbon Project 2013 Top Fossil Fuel Emitters (Absolute) Top four emitters in 2012 covered 58% of global emissions China (27%), United States (14%), EU28 (10%), India (6%) Source: CDIAC Data; Le Quéré et al 2013; Global Carbon Project 2013 Top Fossil Fuel Emitters (Per Capita) Average per capita emissions in 2012 China is growing rapidly and the US is declining fast Source: CDIAC Data; Le Quéré et al 2013; Global Carbon Project 2013 Historical Cumulative Emissions by Country Cumulative emissions from fossil-fuel and cement were distributed (1870–2012): USA (26%), EU28 (23%), China (11%), and India (4%) covering 64% of the total share N° 1 N° 1 Cumulative emissions (1990–2012) were distributed USA (20%), China (18%), EU28 (15%), India (5%) Source: CDIAC Data; Le Quéré et al 2013; Global Carbon Project 2013 Land-Use Change Emissions Land-Use Change Emissions Global land-use change emissions are estimated 0.8 ± 0.5 GtC during 2003–2012 The data suggests a general decrease in emissions since 1990 Indonesian peat fires 2011 and 2012 are extrapolated estimates Source: Le Quéré et al 2013; Houghton & Hackler (in review); Global Carbon Project 2013 Total Global Emissions Total global emissions: 10.5 ± 0.7 GtC in 2012, 43% over 1990 Percentage land-use change: 38% in 1960, 17% in 1990, 8% in 2012 Land use emissions in 2011 and 2012 are extrapolated estimates Source: Le Quéré et al 2013; CDIAC Data; Houghton & Hackler (in review); Global Carbon Project 2013 Observed Emissions and Emissions Scenarios Emissions are on track for 3.2–5.4ºC “likely” increase in temperature above pre-industrial Large and sustained mitigation is required to keep warming below 2ºC Linear interpolation is used between individual data points Source: Peters et al. 2012a; CDIAC Data; Global Carbon Project 2013 Cumulated CO2 emissions and the 2°C target Warming will persist for centuries • Zero CO2 emissions lead to near constant surface temperature. • A large fraction of climate change persists for many centuries. • Depending on the scenario, about 15-40% of the emitted carbon remains in the atmosphere for 1000 yrs. Cumulative carbon determines warming • Peak warming is approximately proportional to cumulative (total) emissions. • Transient climate response to cumulative carbon emissions TCRE = Warming per 1000 PgC Trajectory does not really matter Chapter 12 Final Draft (7 June 2013) IPCC WGI Fifth Assessment Report RCP2.6 Warming is approximately proportional to cumulative emissions. More emissions sooner means less emissions later Transient Climate Response to cumulative carbon emissions (TCRE) Estimated from many independent studies Final Draft (7 June 2013) Chapter 12 IPCC WGI Fifth Assessment Report Figure 12.45: Global temperature change vs. cumulative carbon emissions for different scenarios and models. a) Transient global temperature increase vs. cumulative CO2 emissions for C4MIP (Matthews et al., 2009), b) maximum temperature increase until 2100 vs. cumulative Kyoto-gas emissions (CO2 equivalent, note that all other panels are TCRE best estimate is 0.8-2.5oC warming for 1000 GtC emission Assessed likely range 0.8-2.5°C Warming caused by cumulative carbon emissions to 2010 Warming caused by cumulative carbon emissions to 2020 Warming caused by cumulative carbon emissions to 2050 Warming caused by cumulative carbon emissions to 2100 Warming caused by cumulative carbon emissions to 2100 To limit CO2-induced warming to likely below 2oC, cumulative CO2 emissions must be limited to 1000 GtC. To limit anthropogenic warming to likely below 2oC, cumulative CO2 emissions must be limited to 800 GtC (when accounting for warming from non-CO2 forcing) Cumulative emissions 1870–2013 are 550 ±60 GtC 70% from fossil fuels and cement, 30% from land-use change That leaves about 250 GtC for the future. That’s about 25 years at the current emission level (10 GtC/yr) Anthropogenic CO2 emissions above 10 GtC/yr in 2012, ~60% above 1990 Current rate of increase about 2% per year CO2 represents, by far, the largest contributor to the anthropogenic radiative forcing (> 80%) Global warming scales with cumulative CO2 emissions Limiting global warming likely below 2°C requires emissions to stay below about 800 GtC since preindustrial. 550 GtC already emitted, 250 GtC left for the future… Further Information www.climatechange2013.org © Yann Arthus-Bertrand / Altitude


