mon-1450-baldocchi
advertisement
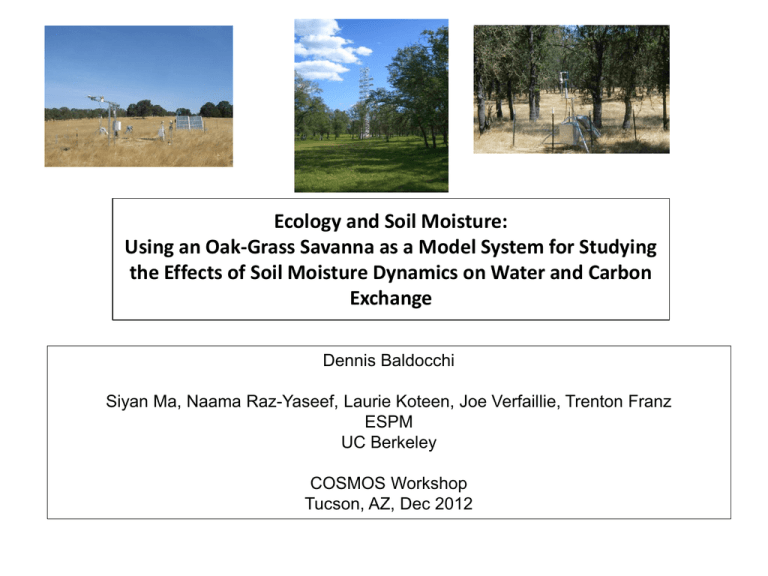
Ecology and Soil Moisture: Using an Oak-Grass Savanna as a Model System for Studying the Effects of Soil Moisture Dynamics on Water and Carbon Exchange Dennis Baldocchi Siyan Ma, Naama Raz-Yaseef, Laurie Koteen, Joe Verfaillie, Trenton Franz ESPM UC Berkeley COSMOS Workshop Tucson, AZ, Dec 2012 Oak-Savanna Model System for Studying the Effect of Soil Moisture on Ecosystem Ecology • Structure/Function – Oak and grasses provide contrasting life forms, woody/herbaceous, perennial/annual – The Canopy is open and heterogeneous, giving us a opportunity to test the applicability of ecosystem and biogeophysical models, mostly developed for ideal and closed canopies • Environmental Biology – The Mediterranean climate provides distinct wet/ cool and dry/hot seasons to examine the ecosystem response (photosynthesis, transpiration, respiration, stomatal conductance) to a spectrum of soil moisture and temperature conditions • Global Change – The Mediterranean climate experiences great extremes in inter-annual variability in rainfall; we experience a wider range in ppt over a few years than long-term predicted changes. Tonzi Ranch Flux Tower Oak-Grass Savanna: A Two Layer System Winter: Trees deciduous; grass green Spring: Trees green;grass green Summer: Trees green; grass dead Oak Savanna consists of Heterogeneous and Open Canopy with Low LAI (< 2.0) Objectives • Examine fluxes of water and carbon with changes in soil moisture – Role of Seasonal Moisture Deficits – Role of Rain Pulses • Explore spatial/temporal variation of soil moisture – – – – Temporal variation with TDR Depth of soil with GPR Root distribution with GPR Soil moisture spatial patterns with EMI O a k S a va n n a W o o d la n d , Io n e , C A 14 12 A Decade of Evaporation Measurements 8 6 4 2 0 150 200 250 300 A n n u a l G ra s s la n d 350 D ay 12 10 8 -1 100 d ) 50 -2 0 L E (M J m L E (M J m -2 -1 d ) 10 6 4 2 0 0 50 100 150 200 D ay 250 300 350 InterAnnual Variation in Water Balance Ppt: 350 to 900 mm ET savannna: 380 to 520 mm ET grass: 280 to 520 mm Io n e , C A 1000 900 ET, O ak Savanna E T , a n n u a l g ra s s la n d W a te r F lu x (m m /y) 800 p re c ip ita tio n 700 600 500 400 300 200 2000 2002 2004 2006 E n d o f H yd ro lo g ic a l Y e a r 2008 2010 In Semi-Arid Regions, ET is Conservative: The Most ET lost, scales with Precipitation during the Drier Years 1000 g ra s s la n d : E T + /- 8 7 m m /y; p p t + /- 1 7 0 m m /y o a k s a va n n a : E T + /- 6 1 m m /y E T (m m /y) 800 600 400 200 200 400 600 800 1000 p p t (m m /y) ‘Mediterranean Ecosystems Don’t evaporate more than 500 mm per year’, Serge Rambal Evaporation from an Oak Savanna > Annual Grassland How and Why? 10 g ra s s la n d S a va n n a 6 LE, M J m -2 d -1 8 4 2 0 0 50 100 150 200 Day 250 300 350 0 .5 o a k s a va n n a g ra s s la n d 0 .4 3 -3 vo lu m e tric so il m o istu re (cm cm ): 0 to 0 .6 0 m Soil Moisture Dynamics at Oak Savanna Differ from Near by Annual Grassland 0 .3 0 .2 0 .1 0 .0 -5 0 0 50 100 150 200 250 300 350 D a ys A fte r Ja n . 1 , 2 0 0 2 Smaller Water Reservoir Contributes to Lack of Trees E/Eeq Eco-hydrology: ET, Functional Type, Physiological Capacity and Drought ? ? ? Effects of Functional Types and Rsfc on Normalized Evaporation 2 .0 0 1 .7 5 w heat c o rn ja c k p in e 1 .5 0 o a k -s a va n n a E / E e q 1 .2 5 1 .0 0 0 .7 5 0 .5 0 0 .2 5 0 .0 0 10 100 1000 10000 -1 R c a n o p y (s m ) Rc is a f(LAI, N, soil moisture, Ps Pathway) 1 .2 5 1 .0 0 s u m m e r ra in E / E e q ET and Soil Water Deficits: Root-Weighted Soil Moisture 0 .7 5 0 .5 0 0 .2 5 0 .0 0 0 .0 0 0 .0 5 0 .1 0 0 .1 5 0 .2 0 0 .2 5 3 0 .3 0 0 .3 5 0 .4 0 -3 w e ig h te d b y ro o ts (cm cm ) G ra ssla n d 1 .0 O a k S a va n n a 1 .2 5 0 .8 1 .0 0 E / E e q E / E e q s u m m e r ra in 0 .7 5 0 .6 0 .4 0 .5 0 0 .2 0 .2 5 0 .0 0 .0 0 0 .0 0 0 .0 5 0 .1 0 0 .1 5 0 .2 0 0 .2 5 0 .3 0 0 .3 5 0 .4 0 0 .0 0 0 .0 5 0 .1 0 0 .1 5 0 .2 0 3 3 -3 w e ig h te d b y ro o ts (cm cm ) 1 .0 O a k S a va n n a 0 .8 Baldocchi et al., 2004 AgForMet 0 .2 5 -3 w e ig h te d b y ro o ts (cm cm ) 0 .3 0 Measuring Spatial/Temporal Variation in Soil Moisture Hourly Sampling, Few points and Depths, Theta Probe Poor Vertical and Horizontal Sampling T o n zi 0 .5 S o il M o istu re 0 .4 0 .3 0 .2 0 .1 0 .0 0 100 200 Day 300 How Deep is the Soil? Trenton Franz, EMI ESI, Moisture Point Many Locations, Discrete Depths, Bi-Weekly, Manual Sampling T o n zi R a n ch , 2 0 0 9 V o lu m e tric S o il M o istu re (cm 3 cm -3 ) 50 0 -1 5 c m 1 5 -3 0 c m 3 0 -4 5 c m 4 5 -6 0 c m 40 30 20 10 0 0 50 100 150 200 Day 250 300 350 Marry the Two Sensor Types Calibrate Theta-Probe with Moisture Point Better Spatio-Temporal Resolution 0 .5 D a ily S a m p lin g W e e k ly S a m p lin g 3 -3 S o il m o is tu re (c m c m ) 0 .4 0 .3 0 .2 0 .1 0 .0 0 50 100 150 200 day 250 300 350 Where are the Roots and How Many? Remote Sensing Coarse Roots with GPR Ground Truth with Soil Pits Vertical Distribution of Roots with Ground Penetrating Radar Raz-Yaseef et al. JGR Biogeosciences, in press Radial Distribution of Coarse Roots, with Ground Penetrating Radar Raz-Yaseef et al. JGR Biogeosciences, in press ET and Soil Water Deficits: How do Trees stay Alive with such Low Water Potentials? oak savanna 1 .0 p re d a w n w a te r p o te n tia l s o il w a te r p o te n tia l E / E e q 0 .8 0 .6 0 .4 0 .2 0 .0 -5 -4 -3 -2 -1 0 so il w a te r p o te n tia l (M P a ) 1 .2 5 Baldocchi et al., 2004 AgForMet a n n u a l g ra s s la n d Root-Weighted Soil Moisture Matches Pre-Dawn Water Potential But, Oak Trees Seem to Tap Ground Water groundwater elevation at Tonzi ground water elevation [m] 158.2 158.18 158.16 158.14 158.12 158.1 158.08 158.06 158.04 158.02 158 156 158 G. Miller, X Chen, Y. Rubin, D. Baldocchi WRR 2010 160 DOY 162 164 166 Pre-Dawn Water Potential Represents Mix of Dry Soil and Water Table During Summer MidDay Water Potential is Less Negative than Shallow Soil Water Potential, Evidence the Trees are tapping Groundwater Miller et al WRR, 2010 ‘Soil Moisture’ Maps with EMI Trenton Franz, U Arizona Water Fluxes are Coupled with Carbon Fluxes O a k S a va n n a , 2 0 0 1 -2 0 1 1 C a n o p y P h o to syn th e sis (g C m -2 -1 d ) 2 0 -2 -4 -6 0 50 100 150 200 Day of Year 250 300 350 Interannual Variation in Net Carbon Exchange: Grassland is Carbon Neutral; Savanna is a C Sink Io n e , C A 400 300 O a k S a va n n a A n n u a l G ra s s la n d N E E (g C m -2 -1 y ) 200 100 0 -1 0 0 -2 0 0 -3 0 0 0 0 -0 1 0 1 -0 1 0 2 -0 3 0 3 -0 4 0 4 -0 5 0 5 -0 6 0 6 -0 7 0 7 -0 8 0 8 -0 9 0 9 -1 0 1 0 -1 1 H yd ro lo g ica l Y e a r Carbon Fluxes Scale with Spring Rainfall O pen G rassland S avanna A n n u al F lu x (g C m -2 ) 1200 1000 800 GPP R eco 600 NEE 400 200 0 -2 0 0 0 50 100 150 200 P P T 3-6 (m m ) Ma et al, 2007 AgForMet 250 300 0 50 100 150 200 P P T 3-6 (m m ) 250 300 Soil Moisture Controls on Respiration 2 .0 F ast g ro w th p erio d d ata R eco /R ref 1 .5 R ain p u lse 1 .0 0 .5 0 .0 0 .0 0 .1 0 .2 0 .3 0 .4 -3 S o il v o lu m etric w ater co n ten t (m 3 m ) Xu + Baldocchi, AgForMet 2004 Sustained and Elevated Respiration after Fall Rain Vaira 2008 9 8 -2 -1 NEE [ mol m s ] 7 6 5 4 3 2 1 0 -1 274 276 278 280 282 DOY 284 286 288 Impact of Rain Pulse, Timing of Rain and Photodegradation on Ecosystem Respiration 6 u n d e rs to ry o p e n g ra s s la n d 4 ( m o l m 3 Fc -2 -1 s ) 5 2 1 0 150 200 250 D ay Baldocchi et al, JGR, Biogeosciences, 2006 300 350 Synthesis and Conclusion CO2 CO2 200 180 a: Photosynthesis > Respiration 160 e: Constraints from Water Budget force the Ecosystem to produce a Sparse Canopy with Limited Leaf Area and Reduced ET 140 120 100 80 10 60 40 b: Photosynthesis scales with Water Use -2 -1 GPP (gC m d ) 8 20 6 20 0 1 2 3 ET (mm d ) 120 140 160 180 -2 -1 s ) 120 0.6 0.05 m 0.50 m 0.5 0.4 f: Photosynthetic Capacity must be Great, for a Short Period when soil water is ample, to Facilitate High Rates of Photosynthesis 100 Vcmax (mol m Volumetric Water Content 100 4 -1 80 60 40 0.3 20 0.2 0 0.1 100 150 200 250 300 350 DOY 0.0 0 50 100 150 200 250 300 350 Broadleaved, Deciduous Trees Day 300 700 250 600 Amass (nmol g-1 s-1) Cumulative Water Flux, mm 80 140 0 d: Stomatal Closure Occurs and Roots tap Ground water to Ensure Evaporation < Precipitation 60 Quercus alba (Wilson et al) Quercus douglasii (Xu and Baldocchi) 2 c: Seasonal Water Deficits Occur & Shorten the Growing Season 40 4 500 400 300 200 ET ppt g: Leaf N and Leaf Thickness must be adequate (high) to support these demands by the Photosynthetic Machinery 200 Quercus douglasii 150 100 50 100 0 0 0 50 100 150 200 Day 250 300 350 60 80 100 120 140 160 Specific Leaf Area (cm 2 g-1) 180 200 Conclusions • Savanna woodlands need about 80 mm more water to function than nearby grasslands – Trees tap ground-water to sustain themselves during the summer • Year to year variability in Carbon Uptake is due to length of wet season. – Oaks are risk adverse and experience less inter-annual variability in NEE than grasslands • Photosynthesis and Respiration are tightly linked – Oaks need high N levels to attain sufficient rates of carbon assimilation for the short growing season • Oaks are darker, warmer and use more water than grasslands Biometeorology Team Funding: US DOE/TCP; NASA; WESTGEC; Kearney; Ca Ag Expt Station
