Operation improvement
advertisement
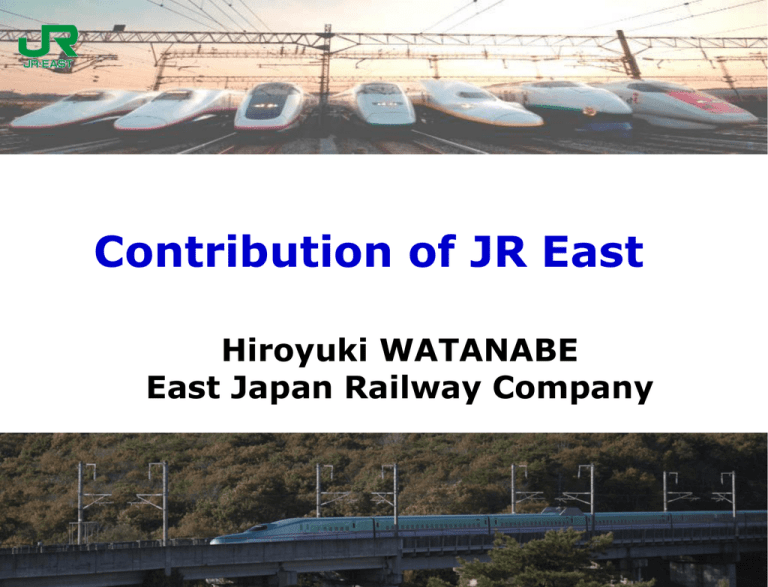
Contribution of JR East Hiroyuki WATANABE East Japan Railway Company Contents - About JR East - What we can contribute to WBSA railways 2 2 About JR East Outline of JR EAST JR EAST is the largest railway company in JAPAN Greater Tokyo area As of March 2013 What we can contribute to WBSA railways - Business improvement - Transport optimization - Infrastructure management - Operation improvement 4 4 What we can contribute to WABS railways - Business improvement - Transport optimization - Infrastructure management - Operation improvement 5 5 Business improvement Division and Privatization of Japanese National Railways 6 6 Business improvement Money flow Japanese National Railways (JNR): 1977 – 1986 Japanese Japanese Nationaland andLocal Local National Governments Governments Subsidies JNR € 46 Billion After reforming: 1987 – 2001 Japanese Japanese Nationaland andLocal Local National Governments Governments Corporation taxes, Fixed asset taxes etc. JR € 19 Billion ※ €1=¥130 Business improvement 8 What we can contribute to WBSA railways - Business improvement - Transport optimization - Infrastructure management - Operation improvement 9 9 Transport optimization (million km) Train car km/day Number of trains/day +22% 1987(JNR) (million) +27% 1987(JNR) 2012.3 Number of passengers/day 2012.3 Congestion rate of peak hour in Tokyo area (%) In the train +20% -25% 10 1987(JNR) 2011 1987(JNR) 2011 Transport optimization Large volume and high transport density (transport demand during peak hours in the Tokyo metropolitan area for each line: Approx. 3,000 persons/3 min.) Joban Line 3,500 persons/ 3 min. Takasaki Line 3,500 persons/ 4 min. 30 sec. Omiya Saikyo Line 2,800 persons/ 2 min. 30 sec. Ikebukuro Shinjuku Chuo Line 2,900 persons/ 2 min. Yamanote Line 3,300 persons/ 2 min.20 sec. Joban Local Line 2,400 persons/ 2 min. 30 sec. Ueno Shibuya Tokyo Sobu Line 3,000 persons/ 2 min.20 sec. Keiyo Line 2,600 persons/ 3 min. Osaki Tokaido Line 3,500 persons/ 3 min. Shinagawa Keihin-Tohoku Line 2,900 persons/ 2 min. 20 sec. (Legend) Line name No. of passengers per train/ train interval Yokohama (FY2010) 11 Transport optimization Modal share (Passenger) What we can contribute to WBSA railways - Business improvement - Transport optimization - Infrastructure management - Operation improvement 13 13 Infrastructure management More than 50 % infrastructure is over its lifetime. Viaducts Bridges 660km (2,800 viaducts) 410km (31,050 bridges) Tunnels Shinkansen lines 1,134.7Km 14 882km (1,260 tunnels) Conventional lines 6,377.9Km JR East Facility management Partner companies Inspection, Maintenance Strengthening, automation Rebuilding the facilities inspection system Rebuilding the construction system What we can contribute to WBSA railways - Business improvement - Transport optimization - Infrastructure management - Operation improvement 16 16 Operation improvement Railway accidents -62% Fall detection mat 1987(JNR) Emergency train stop warning system 2011 Railway crossing accidents -85% Sensing device at level crossing 1987(JNR) 2011 17 17 Operation improvement Natural disaster Rainfall disaster Snow disaster Rock fall Disaster Carried out in the self-financing Rainfall damage measures Snow damage measures Reinforcement Sprinkler Rock fall damage measures Railway forest 18 Operation improvement Monitoring and restrictions ■ Speed restrictions ■ Traffic suspension Rail temp. gauge Snow gauge Scouring detector Seismograph Anemometer Water gauge Network Rain gauge Landslide detector Operation Control Center March 2010 High-speed line Conventional line Total ( per 100km) Rain gauges 29 537 566 (7.5) Water gauges 0 592 592 (7.9) Anemometers 158 699 857 (11.4) Seismograph s 97 196 293 (3.9) 19 Operation improvement JR East must be reliable to respond to customer expectation Extremely high rate of punctuality of operation (average operational delay per train: Shinkansen: 0.3 min.; Conventional lines: 1.1 min.) For JR East lines with large passenger transport volume and high transport density, even a short train delay (2 or 3 minutes) can result in crowds of passengers at stations. Average delay per train 1.4 1.2 Conventional Train minutes 1 Additionally, railways in Japan are highly respected in society, and due to the national character of the Japanese people, highly punctual operations are expected. 0.8 0.6 Shinkansen 0.4 0.2 0 2000 2001 2002 2003 2004 2005 Fiscal Year 2006 2007 2008 2009 (JR East in-house document) 20 JR East’s strong points We have experience and know-how of not only high-speed, but also urban, suburban and regional transport services. And we have provided these services with a high reliability and punctuality. We have experience and know-how of operation and maintenance services as an integrated company. In addition, we have rolling stock manufacturing business. We think that JR East is the only railway company that has these experience and know-how. We have wide range of experience that can respond to any needs or problems. 21 21 Thank you for your attention Hiroyuki WATANABE (watanabe@japanrail.be) Senior Manager East Japan Railway Company, Brussels Office 22
