Distinguish between a population and a sample
advertisement
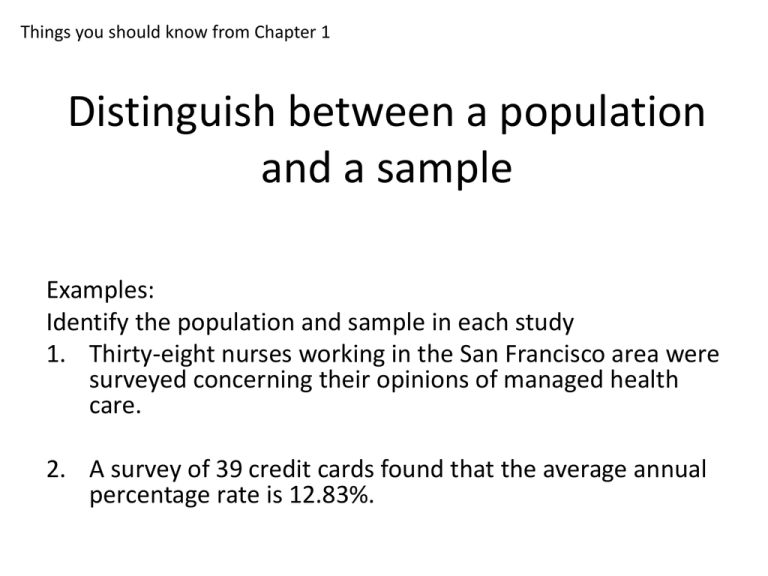
Things you should know from Chapter 1 Distinguish between a population and a sample Examples: Identify the population and sample in each study 1. Thirty-eight nurses working in the San Francisco area were surveyed concerning their opinions of managed health care. 2. A survey of 39 credit cards found that the average annual percentage rate is 12.83%. Things you should know from Chapter 1 Distinguish between a population and a sample ANSWERS Examples: Identify the population and sample in each study 1. Thirty-eight nurses working in the San Francisco area were surveyed concerning their opinions of managed health care. Population – opinions of all nurses in San Fran area. Sample – opinions of the 38 nurses surveyed. 2. A survey of 39 credit cards found that the average annual percentage rate is 12.83%. Population – annual percentage rates of all credit cards. Sample – the percentage rates of the 39 credit cards surveyed. Things you should know from Chapter 1 Distinguish between a parameter and a statistic Examples: Identify if each describes a parameter or a statistic. 1. The 2009 team payroll of the Philadelphia Phillies was $113,004,046. 2. In a survey of 752 adults in the US, 42% think there should be a law that prohibits people from talking on cell phones in public places. 3. In a recent study of math majors at a university, 10 students were minoring in physics. Things you should know from Chapter 1 Distinguish between a parameter and a statistic ANSWERS Examples: Identify if each describes a parameter or a statistic. 1. The 2009 team payroll of the Philadelphia Phillies was $113,004,046. Parameter. 2. In a survey of 752 adults in the US, 42% think there should be a law that prohibits people from talking on cell phones in public places. Statistic. 3. In a recent study of math majors at a university, 10 students were minoring in physics. Parameter. Things you should know from Chapter 1 Distinguish between descriptive statistics and inferential statistics Example: 1. A survey of 39 credit cards found that the average annual percentage rate is 12.83%. - Which part of this study represents the descriptive branch of statistics. Make an inference based on the results of the study. Things you should know from Chapter 1 Distinguish between descriptive statistics and inferential statistics ANSWERS Example: 1. A survey of 39 credit cards found that the average annual percentage rate is 12.83%. - Which part of this study represents the descriptive branch of statistics. 39 credit cards surveyed had an average annual percentage rate of 12.83%. Make an inference based on the results of the study. The average annual percentage rate of all credit cards is 12.83%. Things you should know from Chapter 1 Distinguish between qualitative and quantitative data. Examples: 1. The monthly salaries of the employees at an accounting firm. 2. The social security numbers of the employees at an accounting firm. 3. The marital statuses of all professional golfers. Things you should know from Chapter 1 Distinguish between qualitative and quantitative data. ANSWERS Examples: 1. The monthly salaries of the employees at an accounting firm. Quantitative. 2. The social security numbers of the employees at an accounting firm. Qualitative. 3. The marital statuses of all professional golfers. Qualitative. Things you should know from Chapter 1 Classify data according to the four levels of measurement. Examples: 1. A list of badge numbers of police officers at a precinct. (note: badge numbers can identify officer rank). 2. The horsepowers of racing car engines. 3. The top 10 grossing films released in 2010. 4. The years of birth for the runners in the Boston marathon. Things you should know from Chapter 1 Classify data according to the four levels of measurement. ANSWERS Examples: 1. A list of badge numbers of police officers at a precinct. (note: badge numbers can identify officer rank). Ordinal. 2. The horsepowers of racing car engines. Ratio. 3. The top 10 grossing films released in 2010. Ordinal. 4. The years of birth for the runners in the Boston marathon. Interval. Things you should know from Chapter 1 Know how data are collected – by doing an observational study, performing experiment, using a simulation, using a survey, or taking a census. Examples: Which method of data collection would you use: 1. A study on the effect of low dietary intake of vitamin C and iron on lead levels in adults. 2. A study of charitable donations of the CEOs in Syracuse, New York. 3. A study of college professors’ opinions on teaching classes online. Things you should know from Chapter 1 Know how data are collected – by doing an observational study, performing experiment, using a simulation, using a survey, or taking a census. ANSWERS Examples: Which method of data collection would you use: 1. A study on the effect of low dietary intake of vitamin C and iron on lead levels in adults. Experiment. 2. A study of charitable donations of the CEOs in Syracuse, New York. Census. (or survey – but census would be better) 3. A study of college professors’ opinions on teaching classes online. Survey. Things you should know from Chapter 1 Know good ways to design an experiment. - Sample size, sampling methods, control/placebo with blind studies, replication Things you should know from Chapter 1 Identify/describe the different sampling techniques: simple random sampling, stratified sampling, cluster sampling, convenience sampling, and systematic sampling ANSWERS Examples: Identify the sampling technique. Explain your decision. 1. A student asks 18 friends to participate in a psychology experiment. Convenience – because it is convenient to non-randomly choose your friends. (could be other answers, as long as they are correctly supported) 2. A pregnancy study in Cebu, Philippines randomly selects 33 communities form the Cebu metropolitan area, then interviews all available pregnant women in these communities. Cluster – several groups were randomly selected and all members of those groups were interviewed. 3. Law enforcement officials stop and check the driver of every third vehicle for blood alcohol content. Systematic – a predetermined system to the sampling. 4. Twenty-five students are randomly selected from each grade level at a high school and surveyed about their study habits. Stratified – population divided into groups (grade levels) and students randomly selected from each group. Things you should know from Chapter 1 Identify a biased sample Examples: Identify a bias that might occur in the following studies: 1. A student asks 18 friends to participate in a psychology experiment. 2. Law enforcement officials stop and check the driver of every third vehicle for blood alcohol content. Things you should know from Chapter 1 Identify a biased sample ANSWERS Examples: Identify a bias that might occur in the following studies: 1. A student asks 18 friends to participate in a psychology experiment. Biased – groups of friends tend to have similar traits/personalities. 2. Law enforcement officials stop and check the driver of every third vehicle for blood alcohol content. Not really biased. (could be biased depending on the location – could be outside of a concert/bar/etc)

