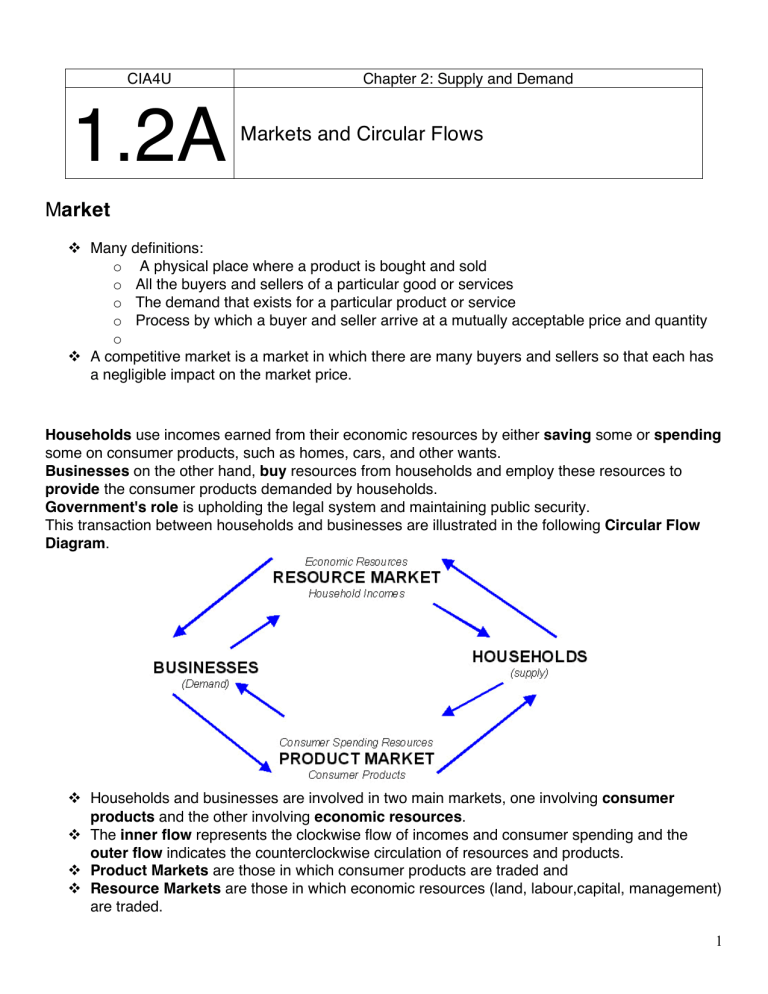
CIA4U 1.2A Chapter 2: Supply and Demand Markets and Circular Flows Market ! Many definitions: o A physical place where a product is bought and sold o All the buyers and sellers of a particular good or services o The demand that exists for a particular product or service o Process by which a buyer and seller arrive at a mutually acceptable price and quantity o ! A competitive market is a market in which there are many buyers and sellers so that each has a negligible impact on the market price. Households use incomes earned from their economic resources by either saving some or spending some on consumer products, such as homes, cars, and other wants. Businesses on the other hand, buy resources from households and employ these resources to provide the consumer products demanded by households. Government's role is upholding the legal system and maintaining public security. This transaction between households and businesses are illustrated in the following Circular Flow Diagram. ! Households and businesses are involved in two main markets, one involving consumer products and the other involving economic resources. ! The inner flow represents the clockwise flow of incomes and consumer spending and the outer flow indicates the counterclockwise circulation of resources and products. ! Product Markets are those in which consumer products are traded and ! Resource Markets are those in which economic resources (land, labour,capital, management) are traded. 1 CIA4U 1.2B Chapter 2: Supply and Demand Demand 2 3 4 CIA4U 1.2C Chapter 2: Supply and Demand Supply 5 6 CIA4U 1.2D Chapter 2: Supply and Demand Market Equilibrium 7 8 Supply and Demand – Submarine sandwiches in Grimsby As the price per sub rises from $1.25 to $2.25, Supply moves from 4000 to 12000 subs, and Demand moves from 12000 to 4000 subs. Now consider two prices: $2.00 and $1.50. 1. At a price of $2.00 per sub: 1. Demand is 6000 subs 2. Supply is 10000 subs 3. Suppliers will quickly find that they have a surplus of subs on their hands. The traditional method of disposing of a surplus of a good or service is to have a sale – to lower the price. At a lower price, demand will increase (the law of demand). This is what will happen. 2. At a price of $1.50 per sub: 1. Supply is 6000 subs 2. Demand is 10000 subs 3. Suppliers will quickly find that they’re sold out of subs, and could easily sell more. 4. To ration the limited supply, a price increase is the answer. The price increase also reduces demand for subs. All suppliers, in unison, will raise their prices. Conclusion: • If the price is above the meeting place of supply and demand, it must decrease. • lIf the price is below the meeting place of supply and demand, it must increase. • In every case, you will find that the price of a good or service in a competitive market is moving towards the one “perfect” price which is called by economists, the “Equilibrium Price.” 9 10 11 CIA4U 1.2E Chapter 2: Supply and Demand Elasticity 12 13 14 15 16 CIA4U Chapter 2: Supply and Demand 1.2F Assignment I: Supply and Demand Directions: Answer the following questions utilizing Supply and Demand theory. Be sure to start with a supply and demand curve along with the equilibrium conditions (see example below). 1. On a diagram below, show what happens to the equilibrium price and quantity in the market for automobiles when there is an increase in the income of consumers. This is an example. “Red” indicates the change. PE2 PE1 E2 S1 E1 D1 QE1 D2 QE2 2. On a diagram below show what happens to the equilibrium price and quantity in the market for cherries when there is good weather. (2A) 3. On a diagram below, show what happens to the equilibrium price and quantity in the market for cars when there is both an increase in the number of consumers and producers.(2A) 4. Use demand and supply curves to illustrate an increase in demand and an increase in quantity supplied. (2A) 17 5. Using demand and supply, show what happens to equilibrium price and quantity when there is a technological advance. (2A) 6. Using demand and supply, show what happens to equilibrium price and quantity when there is an increase in the price of labour. (2A) 7. Using demand and supply, show what happens to equilibrium price and quantity when people become afraid to eat burgars at restaurants due to improper cooking. (2A) 8. Below, use a demand curve to distinguish between an increase in demand and in increase in quantity demanded. (2A) 9. Use demand and supply to show what happens to the equilibrium price and quantity of wheat when the cultivator was introduced. (2A) 10. Use supply and demand to show what happens to the equilibrium price for computer disks when there is a rise in the incomes of our trading partners. (2A) 18 CIA4U Chapter 2: Supply and Demand 1.2G Assignment II: Supply and Demand 12 S 10 Price $ 8 6 4 2 D 0 2 4 6 8 10 12 14 Quantity (Units) Based on the above diagram, answer questions 1 to 10. (14K ) 1. In the diagram above, the equilibrium price is ______ and the equilibrium quantity is ______. 2. Show the equilibrium price and quantity on the diagram. 3. If the price is $10, then the quantity demanded is ______ and the quantity supplied is ______. 4. The situation described in question 3 is called ______________________. 5. What happens to the market price due to the situation in question 3? (3K) ____________________________________________________________________________________ ____________________________________________________________________________________ ____________________________________________________________________________________ ____________________________________________________________________ 6. If the price is $2, then the quantity demanded is _____ and the quantity supplied is _______. 7. The situation described in question 6 is called a ___________________________. 8. What happens to the market price due to the situation described in question 6? (3K) ____________________________________________________________________________________ ____________________________________________________________________________________ ____________________________________________________________________________________ ____________________________________________________________________ 9. The size of the shortage measured in units is _____________. 10. The size of the surplus measured in units is ____________. 19 CIA4U 1.2H Chapter 2: Supply and Demand Assignment III: Supply and Demand THE RELATIONSHIP BETWEEN PRICE AND CHANGES IN DEMAND AND SUPPLY Effect Price (P) Quantity (Q) Demand (D) Supply (S) Increase in Supply Decrease in Supply Increase in Demand Decrease in Demand Increase in Supply & Increase in Demand Increase in Supply & Decrease in Demand Decrease in Supply & Decrease in Demand Decrease in Supply & Increase in Demand 20 CIA4U 1.2I Chapter 2: Supply and Demand Assignment VI: Supply and Demand The following figures are the demand and supply for leather jackets bought and sold from one clothing store: Questions 1. Graph the data and determine the equilibrium price. (2K) 2. Fill in the surplus and shortage column. (1K) 3. On your graph, shade in the areas that represent a surplus or shortage. (1K) 4. Suppose the incomes of customers buying jackets rise. What might happen to the demand for jackets? (1K) 5. Suppose the costs of making jackets falls. What might happen to the supply of jackets? (1K) 21 CIA4U 1.2J Chapter 2: Supply and Demand Assignment V: Supply and Demand You are the owner of a small guest lodge in the Rockies that caters to skiers in the winter and hikers in the summer. Your lodge has 12 double rooms. You must earn $600 per day to meet costs and remain open. You estimate the demand for rooms as follows: ! • D1 is the number of rooms demanded by skiers during the Christmas and March holidays. ! • D2 is the number of rooms demanded during the rest of the ski season. ! • D3 is the number of rooms demanded by hikers during the summer. Questions 1. What rate should you charge for rooms? One rate or a variable rate? Use a demand and supply graph to figure it out. (2 T/I) 2. How much revenue would you gross per day (rate 3 number of rooms)? Subtract your costs and determine your profit for one day in each season. (2T/I) 3. Can you afford to stay open all year round? (1 T/I) 22 CIA4U 1.2K Chapter 2: Supply and Demand Assignment VI: Supply and Demand Below is a demand schedule for blank CDs sold from a music store: Questions 1. In column 3, supply any new figures for quantity that represent a decrease in demand; in column 4, supply figures that represent an increase in demand. (1C) 2. Graph all three-demand curves. (3C) 3. Suggest one possible reason for an increase in demand for CDs among the customers of the store. Suggest one different reason for a decrease in demand. (2C) Below is a supply schedule for the blank CDs: Questions 1. In column 3, supply any new figures for quantity that represent a decrease in supply; in column 4, supply figures that represent an increase in supply. (1C) 2. Graph all three-supply curves. (3C) 3. Suggest one possible reason for an increase in supply for CDs by the supplier. Suggest one different reason for a decrease in supply. (2C) 23 CIA4U 1.2L Unit 2: Supply and Demand Market Failures and Externalities 24 25 26 CIA4U 1.2M Unit 2: Supply and Demand Government Intervention 27 28 29 CIA4U 1.2N Unit 2: Supply and Demand Taxes 30 31

